Probability
estimation of a catastrophic Carrington−like geomagnetic storm:
Re−evaluated in new light of upcoming Maunder Minimum and
recent decreases in geomagnetic field, after recent studies came to
conflicting conclusions; Proposed solutions for citizens and
lawmakers
Abstract
[Abstract
is written mainly for fellow-scientists/researchers; Summary
is more 'broad'.]
In
September 1859, the famous “Carrington Event” occurred
(with estimated Dst readings of −850
nT
to −900
nT),
the largest recorded solar geomagnetic event since accurate records
were made, causing widespread failures to contemporary telegraph
systems and producing brilliant polar aurorae. In July 2012, a solar
storm of much greater strength almost hit earth, narrowly missing
because we'd moved about nine (9) days [about 2.46%
of earth's 365¼−day
orbit] from its trajectory[70], with
a peak Dst value of −1,182
nT, as
reported by Space
Weather[31].
As a result, astronomers & scientists worldwide began calculating
the probability estimation of another catastrophic Carrington−like
geomagnetic event, since current technology (communications, GPS,
power grids, satellites, etc.) are much more vulnerable to a severe
solar storms than in the past when the only 'electronics' available
were long−wire telegraphs—before even the telephone had
been invented. Prior published research gave widely varying
probability estimations of another such event. Moreover, prior
research did not take into account the upcoming Maunder Minimum or
acceleration in the geomagnetic pole movement, and the acceleration
in the collapse of earth's protective magnetic field; nor, did they
account for “lesser” magnetic storms which were very
destructive, in their own right, causing many failures of
communications and the power grid in various parts of the world.
Historically, earth's magnetic north pole has wandered at a rate of
about 0–15 km/year, but beginning in 1990, it accelerated to
its current velocity of about 60 km/year[64][65][66], which affects
compasses, GPS, & other navigation. Moreover,
the last time earth's protective magnetic field dropped by 30%, it
needed fully 3,000 years[56], but, at the rapid rate it's decreasing
now, it's projected to need only about 338.5 or 363.2 years (or 364.3
years or 333.9583 years), to drop by another 30%, depending of which
set of data is used. While the data aren't in complete agreement,
they're all very close, and suggest that a “geomagnetic flip,”
with concurrent field collapse to almost zero strength, is imminent.
This is relevant because the weaker earth's protective magnetic field
gets, the less it protects earth from severe geomagnetic storms. We
review solar/geomagnetic data of all storms from the Carrington Event
until present and estimate the probability of another similar
catastrophic solar storm in
the next decade:
Prior prominent research of another Carrington Event are, at one
extreme, Riley's estimates of about 12%
probability[50], and Moriña's estimates[40] about 1.17%
(taking the average of “0.46% and 1.88%,” from his
research paper). We find an 8.57%
chance of another Carrington−class solar storm in
the next decade.
While we may overestimate the probabilities of another similar storm,
the dangers posed to modern−day technology (much more
vulnerable to geomagnetic solar storms or EMP detonations) suggest
that it's better to use cautious & conservative
estimates—especially given new unknowns and variables, such as
the impending geomagnetic flip and concomitant collapse of earth's
protective magnetic field—which,
of course, make us even more vulnerable to a “direct hit.”
I
stand by my estimate as it's methods are sound, with results between
both extremes in the reported literature—and put forth proposed
solutions for lawmakers and citizens.
Plain
Language Summary [Written
for 'broad' audience: Lawmakers, press, scientists, citizens]
There
have been several recent severe geomagnetic storms which caused
severe disruption to telecommunications and electrical grids, HF
(high−frequency) radio communications, and Global Positioning
System (GPS) navigation: The infamous solar storm of March
1989
inflicted major damage to Quebec, Canada's power grid, causing a
9−hour blackout when transformers were overloaded and failed,
leaving more than 6 million Canadians without power, and crashing
computer hard−drives later that year (August
1989),
resulting in halted trading in the Toronto stock market. In fact,
astronauts aboard the space shuttle Atlantis, during this solar
storm, in October
1989,
“reported
burning in their eyes, a
reaction of their retinas to the solar particles,” according to
the book “Storms From The Sun.”[7][23]
Another
solar storm hit Canada, as well as the northeast United States, in
August 2003,
causing wide−spread blackouts, this time jamming the short−wave
radio frequencies used by commercial pilots, prompting contemporary
observers to speculate that the Kremlin was jamming radio signals.
“In space, some satellites actually tumbled out of control for
several hours,” NASA said. Malmö also
suffered wide−spread failure of their power grids later that
year (October
and November 2003)
in what was dubbed the “Halloween
solar storm” of 2003:
The SOHO (Solar and Heliospheric Observatory) satellite even failed
temporarily, and the Advanced Composition Explorer (ACE) was also
damaged by this solar storm.[20][27][28][51]
More
recently, the “Solar
Storm of 2012,”
a Carrington−class solar storm, widely−believed to be
even larger than the largest recorded solar storm in recorded
history, almost made a “direct hit” on earth, narrowly
missing only because earth had moved about nine (9) days in solar
orbit from its trajectory.[70] As a result, researchers across the
globe began calculating statistical probabilities of a “direct
hit” of another catastrophic Carrington−class solar
storm. Prior published research came up with widely varying
estimates, prompting this researcher to revisit the subject anew.
I
will address three (3) aspects of the dangers of solar storms: (1)
I
will present the dangers and threats of catastrophic damage to
electrical and communications systems;
(2)
I
will attempt to assess the probabilities of estimation of a
catastrophic event; and, lastly,
(3)
I
will offer proposed solutions for both citizens and lawmakers. My
findings suggest that prior research over−estimated
the
probabilities of another catastrophic storm, but that subsequent
research under−estimated,
and
suggest that the actual probabilities of a possible “global
blackout” to
be in−between both extremes. As a result, citizens are advised
to “prepare,” and lawmakers must “harden the grid.”
Furthermore, prior research did not take into account (or discuss)
the fact that even “lesser” storms have been documented
to have produced widespread damage to the communications and
electrical grid, as documented above, which is misleading, because
even “lesser” events have had inflicted very great
damage, with heavy repair costs impacting the economy, including one
instance when the Canadian stock market was shutdown. Lastly, prior
research did not account for the upcoming Maunder Minimum and recent
decreases in earth's protective geomagnetic field, both of which have
an effect on any solar geomagnetic events—not to mention the
increased acceleration of the movement of the geomagnetic poles,
which affect compasses, GPS, and other navigation. Even if this
researcher over-estimates the probability of another catastrophic
event, given the dire consequences of documented damage that would be
done, it's best to have a cautious and conservative
estimate—especially given new unknowns and variables, such as
the impending geomagnetic flip & concomitant collapse of earth's
protective magnetic field—which, of course, make us even more
vulnerable to a “direct hit.”
1.
Introduction [PART
I.
Threats / dangers posed by Solar Events]
The
well−known “Carrington Event” (also known as “The
Solar Storm of 1859”), occurring on September 1–2, 1859,
was a very powerful geomagnetic storm during solar cycle 10
(1855–1867), and one of the largest recorded geomagnetic storms
(as recorded by ground−based magnetometers). The storm produced
some of the brightest and most amazing displays of The Northern
Lights (Aurora
Borealis)
and The Southern Lights (Aurora
Australis)
around the world, so bright, in fact, that many people reported being
able to read a newspaper, at night, by the brilliant “Polar
Lights,” even as far south as the northeastern United
States.[1][2]
More−importantly,
however, this “Carrington−class” solar storm,
widely−believed to be the most powerful solar storm of modern
times, only had a “Dst” (disturbance–storm time)
measurement of about −850
to −900
nT (nanoTelsas), and even the very powerful “Quebec Storm of
1989” (which knocked about 6 million people into a blackout)
registered only about −589
nT. (The Dst measurement is an index calculated from magnetometer
readings around the equator, and, basically, it measures how hard
Earth's magnetic field shakes when a solar storm hits: The more
negative Dst, the more powerful the solar storm. Scientists were able
to get accurate measurements on July 2012 super−storm because,
although it angled away from Earth, nonetheless, it made a “direct
hit” on the solar observation satellite, STEREO−A, which
is especially “hardened” to withstand extreme magnetic
disturbances.[31])
However,
what frightens this researcher is the fact that “Solar Storm of
2012,” had it actually hit earth (it missed us, very narrowly),
would have had a Dst−reading of up to −1,200
nT, making
it much worse than even the infamous Carrington Event.[71] (It had
a peak Dst value of −1,182
nT,
as
reported by Space
Weather[31])
Historians recall that the Carrington Event, which produced brilliant
auroral displays, and also wrought havoc with telegraph systems,
induced such fierce magnetic flux into telegraph pylons that they
sparked violently, even giving some telegraph operators electric
shocks.
The
only thing that saved the planet from wide−spread economic
catastrophe was the fact that most of the electrical equipment in
1859 was very basic. (Telephones were not even invented until 1876.)
Thus, the geomagnetic storm did not have any sensitive “targets”
to damage. In modern times, however, with all of the sensitive
electronics, GPS, telecommunications, power grids, cellular phone
towers, and communications & military satellites, even something
as “small” as the −589
nT “Quebec Storm of 1989” was able to do wide−spread
damage. In fact, a declassified report shows that a strong solar
storm in 1972 may have led to the detonation of mines[18] during the
Vietnam War: Many of the “destructor mines” were designed
to explode if they sensed changes in magnetic fields associated with
moving ships—due to the large metallic content in the target
ships, and the solar storms were apparently strong enough to disturb
the earth's magnetic field, sufficient to trigger the more−than
4,000 sea mines which mysteriously went off with no other obvious
cause. Besides random Solar Storms (which I've shown to be very
capable of sudden damage to “The Grid”–critically
important for providing power to Police, Fire, Ambulance, Hospitals,
gas stations, supermarkets—even 911 & GPS), rogue nations
with nuclear capabilities are also able to detonate an EMP
(Electromagnetic Pulse), a burst of electromagnetic radiation created
by a nuclear explosion, which would have basically the same effect in
the local area where it's detonated—potentially knocking out
all electrical equipment.[68]
In
part I,
here, I have
(hopefully) shown the grave dangers and threats of catastrophic
damage to electrical and communications systems posed by solar storms
and EMP's. In part II,
below, I will address
the key
part of my new
findings: a
new (and, hopefully, more accurate) assessment the statistical
probabilities of estimation of a catastrophic event, and,
then, in part III,
below, I will offer
proposed solutions for both citizens and lawmakers. While the 11−year
solar cycle is well−known, I do not see any scientific research
of probability estimates that take into account the upcoming Maunder
Minimum, or the recent (and accelerating) decreases
in the strength of
earth's geomagnetic field
or the “rapidly
moving” geomagnetic poles:
Scientists have long
known that earth's magnetosphere
protects against
lethal cosmic radiation.
2.
Materials
& Methods [PART
I.
Threats/dangers posed...(continued)]
For
part I,
here (1. Introduction,
2. Materials & Methods, 3. Results listed in Table 1, and 4.
References cited throughout this paper, along with Table 2., a
copy/paste of selected data from other peer−reviewed research
along these lines), I merely gleaned the published
peer−reviewed scientific research papers and credible news
reports of solar storms and the dangers they pose.
For part III,
below, I propose
practical solutions for both citizens and lawmakers: What can
citizens do to protect themselves in the event of a “Failure of
the Grid?” What can lawmakers (City, County, State, Federal, &
International lawmakers—but particularly Federal lawmakers in
America & other countries) do to prepare for such an inevitable
event, and protect key critical infrastructure? However,
for Part II,
my key findings on the
estimations of probability of another catastrophic solar storm, I
will do something “different” than my esteemed colleagues
(who published widely−varying estimates of whether we would
face another Carrington−class event in the upcoming decade or
so): I “cheated” by going directly to the published
reports of such events, beginning with the Carrington Event (when our
recording methods were sufficient to get accurate measurements on the
geomagnetic strength of the storms—a key requirement for
classifying “how strong” a storm must be to do
catastrophic damage), and itemising them individually. Then, by doing
a direct division of quantity of catastrophic storms, divided by
elapsed time, I directly derive the average number of storms in a
given time−period. While this does not take into account the
fact that solar flares, CME's (Coronal Mass Ejections), and
catastrophic solar storms are greater during the peak of each 11−year
“Solar Cycle,” it will, nonetheless, give readers a rough
estimate of long−term probabilities. Then, once this “baseline”
is established, we can hope to make a more precise and accurate
estimation of the probabilities, when considering additional factors,
particularly the
11−year solar cycle,
and the new, and frankly frightening, trend of the rapidly−decreasing
geomagnetic field,
which is associated with (happening at the same time as) the
accelerating velocity of the movement of the geomagnetic poles:
Many GPS navigational and satellite systems depend on the geomagnetic
north and south poles, and these become increasingly inaccurate when
the poles move, another threat to “The Grid.” Also, as
previously mentioned, the earth's magnetosphere protects against
cosmic radiation from all
sources—including CME's and solar flares from earth's sun—which
pose an ever−increasing threat as earth's magnetosphere starts
to collapse, as we head towards another “geomagnetic
reversal”—that is, when Earth's magnetic poles start to
flip again, as they have done many times in the history of our
planet. EDITOR'S NOTE:
When quoting papers, my use of double brackets [] indicates a
line−break, omitted for the sake of space.
|
I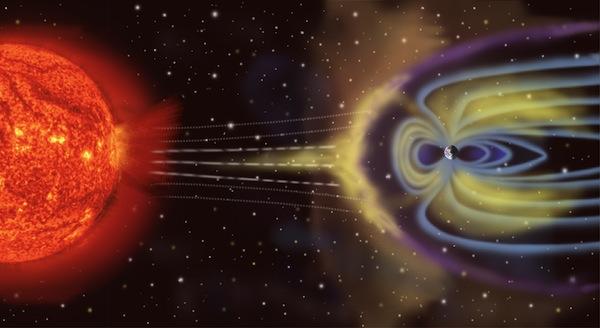
mage
2.
The sun hits earth's protective magnetic field with a CME
(coronal mass ejection), and/or
a solar flare; artist's rendition[76]
|
3.
Results
(with
Tables, Figures, Graphs, photos, etc.) [PART
I.
Threats/dangers posed...(continued)
|
TABLE
1.
List of solar
storms and related events, starting with the infamous “Carrington
Event”
|
|
Date(s)
|
Number
(on this list) – and
Name
(if any) – and Dst
value
|
(Numbered citations to references appear below the table)
Description,
with citations to verify
|
|
Early
September 1859
|
1.
Solar storm of 1859, aka: “The Carrington Event”;
had
an estimated peak Dst value of −850
nT,
as
reported by Moriña[39][40]; had
an estimated peak Dst value of −900
(+50, −150) nT,
as
reported by Cliver[37]
|
Overall most extreme storm ever
documented; telegraph machines reportedly shocked operators and
caused small fires; aurora visible in tropical areas; first
solidly established connection of flares to geomagnetic
disturbances. Extreme storming directly preceded this event in
late August.[1][2][3][4][5][6][7] Please note that this storm
(which is often used as the “baseline” or “standard”
for comparing new solar events) was the absolute most powerful
solar storm to hit planet earth (by several measures, most
particularly the Dst readings and the damage done to electrical
equipment—not to mention the brilliant, very bright,
and very beautiful nighttime auroral displays). However, The
Carrington Event only registered between −850
nT and −1,050 nT,
as
reported in the scientific literature. The “Near miss of
2012,” by contrast, had
a peak Dst value of −1,182
nT,
as
reported by Space
Weather[31],
or even a peak Dst value of −1,200
nT,
as reported by REUTERS[71],
and, had it hit earth (we were about 9 days in orbit past where it
hit)[70], we would have probably experienced a much stronger
electromagnetic flux. Worse yet, much of the modern−day
electronics & communication, on which we depend, is much more
sensitive to such flux than the “primitive” telegraph
equipment that took a brutal bearing in late 1859 when the
Carrington Solar Storm hit earth.
|
|
17−20 November 1882
|
2. Geomagnetic
Storm of 17−20 November 1882; had an estimated peak Dst
value of −386 nT,
as
reported by Space
Weather[8]
|
“In November 1882, an
intense magnetic storm related to a large sunspot group caused
widespread interference to telegraph and telephone systems and
provided spectacular and unusual auroral displays. The (ring
current) storm time disturbance index for this storm reached
maximum −Dst
≈ 386 nT, comparable to Halloween storm of 29−31
October 2003...”[8]
|
|
25−26 September 1909
|
3. Geomagnetic
storm of September 1909; had an estimated peak Dst value of −595
nT,
as
reported by Space
Weather[9]
|
“For this storm, Dst
attained a minimum of −595 nT, comparable to that of the
great magnetic storm of March 1989 (−589 nT; the most
intense storm in terms of Dst of the space age)...The 1909 storm
was one of the most intense of the twentieth century. It exhibited
violent levels of geomagnetic disturbance (with a minimum Dst
value of −595 nT), caused widespread interference to
telegraph systems, and brought spectacular aurorae to the
nighttime sky.”[9]
|
|
13–15 May 1921
|
4. May 1921
geomagnetic storm; had an estimated peak Dst value of −825
to −900 nT,
as
reported by Cliver[37]
|
Among
most extreme known geomagnetic storms; farthest equatorward
(lowest latitude) aurora ever documented; burned out fuses,
electrical apparatus, and telephone station; caused fires at
signal tower and telegraph station; total communications blackouts
lasting several hours
“We
review solar//geophysical data relating to the great magnetic
storm of 14−15 May 1921, with emphasis on observations of
the low−latitude visual aurora...for the 1921 event, there
is a report of aurora from Apia, Samoa, in the southern
hemisphere, within /13° of the geomagnetic equator.”
Such low latitude observations
support the claims above that this is among the most extreme ever
recorded.[10]
|
|
22 January 1938
|
5.
Unnamed
storm; had a peak Dst value of −344
nT,
as
reported by Cliver[36]
|
Odd
that this storm is unnamed, as its −344
nT reading[36] is quite strong. Probably, it was 'conflated'
with the “Fátima storm,” which occurred a few
days later, and was only slightly more powerful (clocking in at
−352
nT):
See below for the “Fátima
storm.”
|
|
25−26 January 1938
|
6. 25−26
January 1938 geomagnetic storm aka the “Fátima
storm”; had
a peak Dst value of −352
nT,
as
reported by Cliver[36]
|
“The
most brilliant display of an aurora borealis in fifty years held
Britons spellbound over a wide area of this country
tonight...During this period all transatlantic communication was
interrupted, and it was not until 11:30 A.M. That normal service
was resumed.” [11]
“A magnetic storm was
recorded at Abinger [Surrey, England] commencing on January 16 at
22·6h.”[12]
|
|
24 March 1940
|
7.
Unnamed
storm; had a peak Dst value of −366
nT,
as
reported by Cliver[36]
|
Odd that this storm is unnamed,
as its −366
nT reading is even stronger than the massive and severe
September 1941 storm, the following year, which only dipped to a
−359
nT reading −yet still managed to create havoc with power
grids, radio communications, and brilliant nighttime auroral
displays.
|
|
01 March 1941
|
8.
Unnamed
storm; had a peak Dst value of −382
nT,
as
reported by Cliver[36]
|
Odd that this storm is unnamed,
as its −382
nT reading is even stronger than the massive and severe
September 1941 storm, just months later, which only dipped to a
−359
nT reading −yet still managed to create havoc with power
grids, radio communications, and brilliant nighttime auroral
displays.
|
|
05 July 1941
|
9.
Unnamed
storm; had a peak Dst value of −453
nT,
as
reported by Cliver[36]
|
Odd that this storm is unnamed,
as its −453
nT reading is even stronger than the massive and severe
September 1941 storm, just months later, which only dipped to a
−359
nT reading −yet still managed to create havoc with power
grids, radio communications, and brilliant nighttime auroral
displays.
|
|
17–19 September 1941
|
10. “The
Geomagnetic Blitz of September 1941”; had
a peak Dst value of −359
nT,
as
reported by Cliver[36]
|
“Seventy−five
years ago next week, a massive geomagnetic storm disrupted
electrical power, interrupted radio broadcasts, and illuminated
the night sky in a World War II battle theater.”[13]
This was strong, but not as
strong as the unnamed storms in March and July of that year, as
shown above.
|
|
28 March 1946
|
11.
Unnamed
storm; had a peak Dst value of −440
nT,
as
reported by Cliver[36]
|
Odd that this storm is unnamed,
as its −440
nT reading is even stronger than the September 1941 storm,
just a few years earlier, which only dipped to a −359
nT reading −yet still managed to create havoc with power
grids, radio communications, and brilliant nighttime auroral
displays.
|
|
26 January 1949
|
12.
Unnamed
storm; had a peak Dst value of −350
nT,
as
reported by Cliver[36]
|
Odd that this storm is unnamed,
as its −350 nT reading is almost as strong as the
September 1941 storm, just a few years earlier, which only dipped
to a −359
nT reading −yet still managed to create havoc with power
grids, radio communications, and brilliant nighttime auroral
displays.
|
|
23 February 1956
|
13. “Solar
Cosmic Rays of February, 1956”; No data available for the
Dst values of this event, but it was probably pretty strong, as it
fell close to the 05 September 1957 event, which had a Dst
value of −324
nT,
as
reported by Cliver[36]
|
“The
solar flare event was superposed by chance upon a large but
typical intensity decrease of nonsolar cosmic rays which began
several days prior to February 23.”[14]
“The 23 February 1956
ground level enhancement of the solar cosmic ray intensity (GLE05)
is the most famous among the proton events observed since
1942...It is shown that the most outstanding features of this
proton enhancement were a narrow and extremely intense beam of
ultra−relativistic particles arriving at Earth just after
the onset and the unusually high maximum solar particle
energy.”[15]
|
|
05 September 1957
|
14.
Unnamed
storm; had a peak Dst value of −324
nT,
as
reported by Cliver[36]
|
Odd that this storm is unnamed,
as its −324 nT reading[36] is almost as strong as the
solar storm eight days later (13 September 1957), which only
dipped
to a −426
nT reading
−yet still managed to be categorised as one of the “most
intense superstorms observed.”[16] Probably these two solar
storms were 'conflated' with one another because they were only
about a week apart.
|
|
13 September 1957
|
15. Geomagnetic
storm of September 1957; had
a peak Dst value of −426
nT,
as
reported by Cliver[36]; had a peak Dst
value of −427
nT,
as
reported by NOAA[28]
|
“This paper presents
results of reconstruction of the ionospheric weather during
five of the most intense superstorms observed
since International Geophysical Year, IGY (1957,
1958, 1959, 1989, and 2003) with the instantaneous global maps of
the F2 layer critical frequency, GIM−foF2, and the
ionospheric weather index maps, GIM−Wf. ”(Emphasis
added for clarity and to differentiate; not in original)[16]
|
|
23 September 1957
|
16.
Unnamed
storm; had a peak Dst value of −302
nT,
as
reported by Cliver[36]
|
Odd that this storm is unnamed,
as its −302 nT reading[36] is almost as strong as the
solar storm on 13 September 1957, just 10 days earlier, which only
dipped
to a −426
nT reading
−yet still managed to be categorised as one of the “most
intense superstorms observed.”[16] Perhaps these two solar
storms got 'conflated' together since they were only about a week
apart.
|
|
11 February 1958
|
17. Geomagnetic
storm of February 1958; had
a peak Dst value of −428
nT,
as
reported by Cliver[36]; had a peak Dst
value of −426
nT,
as
reported by NOAA[28]
|
“This paper presents
results of reconstruction of the ionospheric weather during
five of the most intense superstorms observed
since International Geophysical Year, IGY (1957,
1958,
1959, 1989, and 2003) with the instantaneous
global maps of the F2 layer critical frequency, GIM−foF2,
and the ionospheric weather index maps, GIM−Wf. ”(Emphasis
added for clarity and to differentiate; not in original)[16]
|
|
08 July 1958
|
18.
Unnamed
storm; had a peak Dst value of −334
nT,
as
reported by Cliver[36]
|
Odd that this storm is unnamed,
as its −334 nT reading[36] is almost as strong as the
solar storm on 13 September 1957, which only dipped
to a −426
nT reading
−yet still managed to be categorised as one of the “most
intense superstorms observed.”[16]
|
|
04 September 1958
|
19.
Unnamed
storm; had a peak Dst value of −305
nT,
as
reported by Cliver[36]
|
Odd that this storm is unnamed,
as its −305 nT reading[36] is almost as strong as the
solar storm on 13 September 1957, which only dipped
to a −426
nT reading
−yet still managed to be categorised as one of the “most
intense superstorms observed.”[16]
|
|
15 July 1959
|
20. Geomagnetic
storm of July 1959; had
a peak Dst value of −434
nT,
as
reported by Cliver[36]; had a peak Dst value of −429
nT,
as
reported by NOAA[28]
|
“This paper presents
results of reconstruction of the ionospheric weather during
five of the most intense superstorms observed
since International Geophysical Year,
IGY (1957, 1958, 1959,
1989, and 2003) with the instantaneous global
maps of the F2 layer critical frequency, GIM−foF2, and the
ionospheric weather index maps, GIM−Wf.”(Emphasis
added for clarity and to differentiate; not in original)[16]
|
|
01 April 1960
|
21.
Unnamed
storm; had a peak Dst value of −325
nT,
as
reported by Cliver[36]
|
Odd that this storm is unnamed,
as its −325 nT reading[36] is almost as strong as the
solar storm on 13 September 1957, which only dipped
to a −426
nT reading
−yet still managed to be categorised as one of the “most
intense superstorms observed.”[16]
|
|
30 April 1960
|
22.
Unnamed
storm; had a peak Dst value of −325
nT,
as
reported by Cliver[36]
|
Odd that this storm is unnamed,
as its −325 nT reading[36] is almost as strong as the
solar storm on 13 September 1957, which only dipped
to a −426
nT reading
−yet still managed to be categorised as one of the “most
intense superstorms observed.”[16]
|
|
13 November 1960
|
23.
Unnamed
storm; had a peak Dst value of −333
nT,
as
reported by Cliver[36]; had
a peak Dst value of −339
nT,
as
reported by NOAA[36]
|
Odd that this storm is unnamed,
as its −333 nT reading[36] is almost as strong as the
solar storm on 13 September 1957, which only dipped
to a −426
nT reading
−yet still managed to be categorised as one of the “most
intense superstorms observed.”[16]
|
|
26 May 1967
|
24. The “Space
weather storm of late May 1967”; had
a peak Dst value of −391
nT,
as
reported by Cliver[36]; had a peak Dst
value of −387
nT,
as
reported by NOAA[28]
|
Blackout
of polar surveillance radars during Cold War led U.S. military to
scramble for nuclear war until solar origin confirmed
“Although listed as one of
the most significant events of the last 80 years, the space
weather storm of late May 1967 has been of mostly fading academic
interest. The storm made its initial mark with a colossal solar
radio burst causing radio interference at frequencies between 0.01
and 9.0 GHz and near−simultaneous disruptions of dayside
radio communication by intense fluxes of ionizing solar X−rays.
Aspects of military control and communication were immediately
challenged.”[17]
|
|
Early August 1972
|
25. Solar storm of
August 1972; had
a peak Dst value of −125
nT,
as
reported by Space
Weather[18]
|
Fastest
CME transit time recorded; most extreme solar particle event (SPE)
by some measures and the most hazardous to human spaceflight
during the Space Age; severe technological disruptions, caused
accidental detonation of numerous magnetic−influence sea
mines.
“Although the magnetic
storm index, Dst, dipped to only −125 nT, the magnetopause
was observed within 5.2 RE and the plasmapause within 2 RE.
Widespread electric− and communication−grid
disturbances plagued North America late on 4 August. There was an
additional effect, long buried in the Vietnam War archives that
add credence to the severity of the storm impact: a nearly
instantaneous, unintended detonation of dozens of sea mines south
of Hai Phong, North Vietnam on 4 August 1972. The U.S. Navy
attributed the dramatic event to magnetic perturbations of
solar storms.”[18]
|
|
14 July 1982
|
26.
Unnamed
storm; had a peak Dst value of −322
nT,
as
reported by Cliver[36]
|
Odd that this storm is unnamed,
as its −322 nT reading[36] is almost as strong as the
solar storm on 13 September 1957, which only dipped
to a −426
nT reading
−yet still managed to be categorised as one of the “most
intense superstorms observed.”[16]
|
|
8−9
February 1986
|
27.
The
Geomagnetic Storm of 8−9 February 1986;
had a peak Dst value of −301
nT,
as
reported by the Royal
Academy of Engineering[41];
had
a peak Dst value of −307
nT,
as
reported by the Research
in Astronomy and Astrophysics[42]
|
Even
during a “solar minimum,” you can experience very
powerful solar flares, such as this example:
“Another
significant event was the geomagnetic storm of 8−9 February
1986, which saw Dst drop to −301 nT. This event is
significant because of its timing very close to sunspot minimum,
which nominally occurred in September 1986, but which would have
been in March 1986 if the February storm had not occurred. This
storm shows that extreme events can occur at any phase of the
solar cycle and it is unwise to focus mitigation efforts only
around solar maximum.” (pp.17—18){small
quote used under Fair Use}[41]
“We
have plotted all seven storm events together in Figure 1. The
first case of super storm was recorded on February 09, 1986 and
was associated with a number of solar flares of low intensities
occurred. The peak of the storm was observed at 01:00 UT on
February 09. By chance this storm was the largest recorded storm,
since 1960 and the eighth largest since 1932 (Allen 1986). Two
other factors made this storm particularly unusual (i) it occurred
near the minimum of the Sun’s activity cycle; and (ii) it
was apparently caused by flares that could be described as
moderate to large. The initial phase of this storm was started on
06 Feb at 21:00 UT and continued till Feb 07 till 07:00 UT and the
main phase occurred with its minimum value (Dst index −307
nT) on Feb 09 at 01:00 UT, then it reached to its recovery phase
and this phase continued till Feb 13 at 23:00 UT.”[42]
|
|
13−14 March 1989
|
28. March 1989
geomagnetic storm; aka the “Quebec
Storm of 1989”; had a peak Dst value of −589
nT, as
reported by NOAA[28]
and by Cliver[37] and by Kane[43]; had a peak Dst
value of −595 nT, as
reported by Space
Weather[9];
had a peak Dst value of −548 nT,
as previously
reported by Cliver[36]
|
The
infamous solar storm of March 1989 was the most
extreme storm of the Space Age by several measures: It outed power
grid of Canadian province of Quebec, causing
a 9−hour blackout when transformers were overloaded and
failed, leaving more than 6 million Canadians without power.
“The CME associated with
the X15 flare in March 1989 caused major power failures in Canada,
and subsequent smaller events have disrupted communication and
navigation satellites. Also, had the flare occured [sic] over the
weekend we could have seen a major proton storm such as the one
observed last July, when a number of SOHO's imaging instruments
were temporarily blinded.”(Misspelling in original, denoted
by 'sic' in brackets.)[19]
|
|
August 1989
|
29.
August
1989 geomagnetic
storm;
No data available for the Dst values of this event. (Probably
around the −589
nT, value
for the “Quebec Storm of 1989,” above, as reported by
NOAA[28],
as it was pretty strong: It crashed the Canadian stock
market—quite literally.)
|
“The
Toronto stock market in Canada halted trading after solar activity
crashed a series of computer hard drives in August 1989. []
Trading
was stopped for three hours. []
"I
don't know what the gods were doing to us," said exchange
vice−president John Kane.”[20]
“SCIENTISTS
blame an intense burst of solar activity for events which
halted all trading on Toronto’s stock market
last month. Officials watched
in disbelief as three disc drives failed in
succession on what is supposed
to be a ‘fault−tolerant’ computer
system. The crash stopped trading for
three hours.”[21]
“A
significant geomagnetic storm caused by a very large X20 solar
flare affected microchips and lead to the halt of Toronto’s
stock market trading on August 16, 1989. [] The solar flare was
stronger than the X15 flare recorded in March of the same year.
That flare caused extremely intense auroras and a geomagnetic
storm that lead to the collapse of Hydro−Québec's
electricity transmission system.”[22]
|
|
10
October 1989
|
30.
The
solar storm of October 1989; had a peak Dst value of −268
nT,
as
reported by Kane[36]
|
Even
a so−called “mild” storm of Dst level −268
nT
was
able to inflict serious threat upon our astronauts:
“Astronauts
aboard the space shuttle Atlantis, during this solar storm, in
October 1989, "reported burning in their eyes, a reaction of
their retinas to the solar particles", according to the book
Storms From The Sun. [] "The crew was ordered to go to the
'storm shelter' in the farthest interior of the shuttle, the most
shielded position. But even when hunkered down inside the
spacecraft, some astronauts reported seeing flashes of light even
with their eyes closed," the
book notes, adding that if the astronauts had been on a deep−space
mission or working on the Moon, there
was a 10 per cent chance they would have died.”(Emphasis
added, in bold−face & underline, for clarity; not in
original)[20][23]
|
|
17 November 1989
|
31.
The
solar storm of November 1989; had a peak Dst value of −266
nT,
as
reported by Kane[36]
|
Odd that this storm is unnamed:
While Kane does not discuss this solar storm in his paper, it's
almost the same intensity as the one the month before that caused
major discomfort for our astronauts, and almost placed their lived
in danger. See “Table 1” of this citation for
data.[36]
|
|
25 March 1991
|
32.
Unnamed
storm; had a peak Dst value of −297
nT,
as
reported by Cliver[36]
|
Odd that this storm is unnamed,
as its −297 nT reading[36] is almost as strong as the
solar storm on 13 September 1957, which only dipped
to a −426
nT reading
−yet still managed to be categorised as one of the “most
intense superstorms observed.”[16]
|
|
09 November 1991
|
33.
Unnamed
storm; had a peak Dst value of −375
nT,
as
reported by Cliver[36]; had
a peak Dst value of −354
nT,
as
reported by NOAA[28]
|
Odd that this storm is unnamed,
as its −375 nT reading is even stronger than the
massive and severe September 1941 storm, just decades earlier,
which only dipped to a −359 nT reading −yet still
managed to create havoc with power grids, radio communications,
and brilliant nighttime auroral displays.
|
|
06 April 2000
|
34.
April
geomagnetic storm of 2000; had
a peak Dst value [at 01:00 UT, on 04/07/2000, which was really the
same storm, as it was within a 24−hour period of 06 April
2000] of −287
nT,
as
reported by Geophysical
Research Letters[38]
|
Geomagnetic
storm was so strong that it was felt even down to about 42° in
geographic latitude:
“This paper reports on the
first observations of postsunset/evening midlatitude plasma
bubbles in the European sector during the main phase of severe
storms (Dst≤−200 nT) on 6 April 2000 and 11
April 2001. Plasma depletions observed in Global Navigation
Satellite System total electron content measurements are confirmed
with those observed from in situ Defense Meteorological Satellite
Program ion density measurements. The results show that the plasma
bubbles were migrating north at virtual speeds of 400 m/s and on
each of the storm days they extended as far north as ̃42°
(geographic latitude).”(Emphasis
added, in bold−face & underline, for clarity; not in
original)[24]
|
|
14 July 2000
|
35.
The “Bastille Day Flare” aka the “Bastille Day
Event”; No data available for the Dst values of this event,
but it was probably pretty strong, as interfered
with
radio communications, could be seen even by the distant Voyager 1
and 2 space probes, and put on impressive auroral displays, and
was the largest solar radiation event since 1989; UPDATE: had
a peak Dst value of −69
nT,
as
reported by Halo CME[36]
|
A
powerful solar flare on Bastille Day (July 14, 2000), the national
day of France and was the biggest solar radiation event since
1989, which scientists were describing as the space equivalent of
a Category 4 hurricane on the 5−point Saffir−Simpson
scale, and even, despite their great distance from the Sun,
observed by the Voyager 1 & Voyager 2 deep−space probes:
“The
eruption of a powerful flare on the surface of the sun Friday has
triggered what scientists are calling the biggest solar radiation
event since the fall of 1989. [] The flare was followed by a
coronal mass ejection a blast of billions of tons of electrically
charged atomic particles and magnetic energy hurled in the Earth's
direction at 3 million mph. [] The blast was expected to trigger
"strong" to "severe" geomagnetic disturbances
this weekend affecting power grids, pipelines, navigation systems,
shortwave radio communications and satellite operations. [] And
skywatchers were advised to look for displays of the Northern
Lights about midnight tonight at latitudes spanning much of the
United States. [] Space weather forecasters were describing the
solar storm as the space equivalent of a Category 4 hurricane on
the 5−point Saffir−Simpson scale. [] "I think
it's probably the second−largest (storm) in the last 20
years," said Bill Murtaugh, a space weather forecaster at the
federal Space Environment Center in Boulder, Colo.”[25]
“This energetic particle
decrease is thus slightly smaller in magnitude at the Earth than
the two earlier transient events occurring in July 1982 and June
1991 that later produced large increases of very low frequency
radio emission seen by instruments on Voyager 1 and Voyager 2 when
the interaction regions from these events eventually encountered
the heliopause some 410 days later [Gurnett et al., 1993].”[26]
|
|
16 July 2000
|
36.
Unnamed
storm; had a peak Dst value of −301
nT,
as
reported by Cliver[36]; had
a peak Dst value of −301
nT,
as
reported by Geophysical
Research Letters[38];
had a peak Dst value of −301
nT,
as
reported by Earth,
Planets and Space[46]
|
Odd
that this storm is unnamed, as its −301 nT reading[36] is
quite strong. Probably, it was 'conflated' with the “Bastille
Day Event,” which was only two days earlier. (See
immediately above in this table.) Moreover, it is also odd that
Cliver[36] does not give a Dst reading for the “Bastille Day
Flare,” which was two days earlier, on 14 July 2000. But it
is assumed that these are two different solar flares, because the
dates are different, and moreover, the solar flare and CME's a few
days earlier would probably have had a stronger value. [Note to
self: Look up a Dst reading for the “Bastille Day Event.”]
Note:
Earth,
Planets and Space
reported:
“ In
the case of the solar sources of the Bastille geomagnetic storm
that occurred on July 15–17, 2000, with a Dst minimum of
−301 nT...,”[46] but we take this to refer to the 16
Jul 2000 entry, taking the average of 15 and 17, so as to
differentiate this event from the event 2 days prior. Their
readings agree with others, so all is well, here.
|
|
31 March 2001
|
37.
Unnamed
storm; had a peak Dst value of −383
nT,
as
reported by Cliver[36]; had
a peak Dst value of −387
nT,
as
reported by NOAA[28];
had
a peak Dst value of −383
nT,
as
reported by Geophysical
Research Letters[38]
|
Odd that this storm is unnamed,
as its −383 nT reading[36] is quite strong. Probably, it was
'conflated' with the continuing solar flares, CME's, and
continuation of the solar storm which went on into the following
month, as shown below. Indeed, very odd, since the following
readings, while severe, were only reported by Space Weather
to be Dst≤−200 nT, or so, not nearly as severe as the
peak −383 nT readings, here.[24]
|
|
11 April 2001
|
38.
April
geomagnetic storm of 2001; had
a peak Dst value [at 00:00 UT, on 04/12/2000, which was really the
same storm, as it was within a 24−hour period of 11 April
2000] of −271
nT,
as
reported by Geophysical
Research Letters[38]
|
Geomagnetic
storm was so strong that it was felt even down to about 42° in
geographic latitude:
“This paper reports on the
first observations of postsunset/evening midlatitude plasma
bubbles in the European sector during the main phase of severe
storms (Dst≤−200 nT) on 6 April 2000 and 11 April
2001. Plasma depletions observed in Global Navigation
Satellite System total electron content measurements are confirmed
with those observed from in situ Defense Meteorological Satellite
Program ion density measurements. The results show that the plasma
bubbles were migrating north at virtual speeds of 400 m/s and on
each of the storm days they extended as far north as ̃42°
(geographic latitude).”(Emphasis
added, in bold−face & underline, for clarity; not in
original)[24]
|
|
06 November 2001
|
39.
Unnamed
storm;
had
a peak Dst value of −292
nT,
as
reported by Geophysical
Research Letters[38]
|
Odd that this storm is unnamed,
as its −292 nT reading[38] is almost as strong as the
solar storm on 13 September 1957, which only dipped
to a −426
nT reading
−yet still managed to be categorised as one of the “most
intense superstorms observed.”[16]
|
|
29−30 October 2003
|
40. Halloween solar
storms, 2003; had a 'provisional' peak Dst value of −401
nT,
as
reported by NOAA
in
June 2004[28] and Kane [43]; had a
final peak Dst value [at 01:00] of −353
nT,
as
reported by Geophysical
Research Letters
in
Feb. 2008[38]; had a final peak Dst
value [at 23:00] of −383
nT,
as
reported by Geophysical
Research Letters
in
Feb. 2008[38]
|
Among
the top few most intense storms of the Space Age:
“In
October and November of 2003, well into the
declining phase of Solar Cycle 23, the Sun produced a significant
display of solar activity, including one of the most intense solar
flares ever recorded.”(Emphasis
added in bold−faced underline to differentiate; not in
original.)[28]
“The October−November
2003 solar storms rank as one of the largest outbreaks of solar
activity in recent history. The global effects were wide ranging,
impacting power grids, airline flights, spacecraft operations, and
much more. Media interest and public awareness of this activity
was at the highest levels ever...With little warning, large and
intense sunspot groups developed on the solar surface, and by the
end of October 2003, NOAA Space Weather Forecasters were engaged
in the most active and demanding solar activity epoch in
years...Seventeen major flares erupted on the sun between October
19 – November 05, 2003, including perhaps the most
intense flare ever seen by a GOES XRS instrument – a huge
X28 flare (NOAA scale R5 – see Appendix A and B) on November
04. Many of these flares had associated radiation storms,
including an S4 (severe) storm on October 29.”(Emphasis
added in bold−faced underline to differentiate; not in
original.) [27]
|
|
20−21 November 2003
|
41. Solar storms of
November 2003; had a 'provisional' peak Dst value of −465
nT,
as
reported by NOAA
in
June 2004[36]; had
a peak Dst value of −383
nT,
as
reported by Cliver in Oct. 2004[36]; had a final peak Dst value of
−472
nT,
as
reported by Kane in Feb. 2005[43]; had
a final peak Dst value of −422
nT,
as
reported by Geophysical
Research Letters
in
Feb. 2008[38]; had a final peak Dst value of −422
nT,
as
reported by Earth,
Planets and Spacs
in
Feb. 2008[46]
|
Among
the top few most intense storms of the Space Age:
“In
October and November of 2003,
well into the declining phase of Solar Cycle 23, the Sun produced
a significant display of solar activity, including one of the most
intense solar flares ever recorded.”(Emphasis
added in bold−faced underline to differentiate; not in
original.)[28]
“The
October−November 2003 solar storms rank as one
of the largest outbreaks of solar activity in recent history. The
global effects were wide ranging, impacting power grids, airline
flights, spacecraft operations, and much more. Media interest and
public awareness of this activity was at the highest levels
ever...With little warning, large and intense sunspot groups
developed on the solar surface, and by the end of October 2003,
NOAA Space Weather Forecasters were engaged in the most active and
demanding solar activity epoch in years...Seventeen major flares
erupted on the sun between October 19 – November 05,
2003, including perhaps the most intense flare ever seen
by a GOES XRS instrument – a huge X28 flare (NOAA scale R5 –
see Appendix A and B) on November 04. Many of these flares had
associated radiation storms, including an S4 (severe) storm on
October 29.”(Emphasis added in bold−faced underline to
differentiate; not in original.)[27]
“Previous
studies have suggested that solar flares of modest intensity and
duration can produce severe geomagnetic storms. In the case of the
solar sources of the Bastille geomagnetic storm that occurred on
July 15–17, 2000, with a Dst minimum of −301 nT, the
duration of the solar flare was 40 min (Andrews 2001). In case of
the solar sources of the Halloween geomagnetic storm that occurred
November 20–21,
2003, with
a Dst minimum of −422 nT, three long−durational event
(LDE) flares with intensities less than M5.0 were reported (e.g.,
Gopalswamy et al. 2005). This demonstrates that a strong
geoeffective solar wind driver can be produced from a solar flare
modest of intensity and duration.”(Emphasis added in
bold−faced underline to differentiate; not in original.)[46]
|
|
08 November 2004
|
42.
Unnamed
storm;
had
a peak Dst value [at 07:00 UT] of −373
nT,
as
reported by Geophysical
Research Letters[38]
|
Odd
that this storm is unnamed, as its −373 nT
reading[38] is almost as strong as the solar storm on 13 September
1957, which only dipped
to a −426
nT reading
−yet still managed to be categorised as one of the “most
intense superstorms observed.”[16]
This is a separate solar storm than the one below, on 11/10/2004:
They are more than 48 hours apart.
|
|
10 November 2004
|
43.
Unnamed
storm;
had
a peak Dst value [at 10:00 UT] of −289
nT,
as
reported by Geophysical
Research Letters[38]
|
Odd
that this storm is unnamed, as its −289 nT
reading[38] is almost as strong as the solar storm on 13 September
1957, which only dipped
to a −426
nT reading
−yet still managed to be categorised as one of the “most
intense superstorms observed.”[16]
This is a separate solar storm than the one above, on 11/08/2005:
They are more than 48 hours apart.
|
|
20−22 January 2005
|
44.
The “Giant
Solar Storm of January 2005” aka the “Anomalous
geomagnetic storm of January 2005”;
had
a peak Dst value of −105
nT,
as
reported by Journal
of Geophysical Research[44]
|
Even
though this solar storm only clocked in at −105
nT [44], it was able to present a major threat, and the “giant
GLE of 2005 January 20 was the second largest on record (and
largest since 1956), with up to 4200% count rate enhancement at
sea level.,”[30] as documented below:
“One
of the largest recorded solar radiation storms, on 20 January
2005, resulted in up to 55−fold increases in the count rates
of ground−based particle detectors in polar regions.”[29]
“A
ground level enhancement (GLE) is a solar event that accelerates
ions (mostly protons) to GeV range energies in such great numbers
that ground−based detectors, such as neutron monitors,
observe their showers in Earth's atmosphere above the Galactic
cosmic ray background. GLEs are of practical interest because an
enhanced relativistic ion flux poses a hazard to astronauts, air
crews, and aircraft electronics, and provides the earliest direct
indication of an impending space radiation storm. The giant GLE of
2005 January 20 was the second largest on record (and largest
since 1956), with up to 4200% count rate enhancement at sea level.
”[30]
“The major (minimum Dst =
−105 nT) magnetic storm which occurred on 21–22
January 2005 is highly anomalous because the storm main phase
(identified by the SYM−H indices) developed during northward
interplanetary magnetic fields (IMFs). We believe this to be the
first event of its type to be reported in the literature.”[44]
|
|
15 May 2005
|
45.
Unnamed
storm;
had
a peak Dst value of −263
nT,
as
reported by Geophysical
Research Letters[38]
|
Odd that this storm is unnamed,
as its −263 nT reading[38] is almost as strong as the
solar storm on 13 September 1957, which only dipped
to a −426
nT reading
−yet still managed to be categorised as one of the “most
intense superstorms observed.”[16]
|
|
23−24 July 2012
|
46.
The “Near Miss of 2012” aka the “Solar
Superstorm of 2012”[32][33]; had
a peak Dst value of −1,182
nT,
as
reported by Space
Weather[31];
had a peak Dst value of −1,200
nT,
as reported by REUTERS[71]
|
“On
23 July 2012, solar active region 1520 (~141°W heliographic
longitude) gave rise to a powerful coronal mass ejection (CME)
with an initial speed that was determined to be 2500 ± 500
km/s. The eruption was directed away from Earth toward 125°W
longitude. STEREO−A sensors detected the CME arrival only
about 19 h later and made in situ measurements of the solar wind
and interplanetary magnetic field. In this paper, we address the
question of what would have happened if this powerful
interplanetary event had been Earthward directed. Using a
well−proven geomagnetic storm forecast model, we find that
the 23−24 July event would certainly have produced a
geomagnetic storm that was comparable to the largest events of the
twentieth century (Dst ~ −500 nT). Using plausible
assumptions about seasonal and time−of−day orientation
of the Earth's magnetic dipole, the most extreme modeled value of
storm−time disturbance would have been Dst = −1182 nT.
This is considerably larger than estimates for the
famous Carrington storm of 1859. This finding has
far reaching implications because it demonstrates that extreme
space weather conditions such as those during March of 1989 or
September of 1859 can happen even during a modest solar activity
cycle such as the one presently underway. We argue that this
extreme event should immediately be employed by the space weather
community to model severe space weather effects on technological
systems such as the electric power grid.”(Emphasis
added in bold−faced underline for clarity; not in
original.)[31]
“Last
month (April 8−11), scientists, government officials,
emergency planners and others converged on Boulder, Colorado, for
NOAA's Space Weather Workshop—an annual gathering to discuss
the perils and probabilities of solar storms. [] The current solar
cycle is weaker than usual, so you might expect a correspondingly
low−key meeting. On the contrary, the halls and meeting
rooms were abuzz with excitement about an intense solar storm that
narrowly missed Earth. [] "If it had hit, we would still be
picking up the pieces," says Daniel Baker of the University
of Colorado, who presented a talk entitled The Major Solar
Eruptive Event in July 2012: Defining Extreme Space Weather
Scenarios.”[34]
“If
an asteroid big enough to knock modern civilization back to the
18th century appeared out of deep space and buzzed the Earth−Moon
system, the near−miss would be instant worldwide headline
news. [] Two years ago, Earth experienced a close shave just as
perilous, but most newspapers didn't mention it. The "impactor"
was an extreme solar storm, the most powerful in as much as 150+
years. [] "If it had hit, we would still be picking up the
pieces," says Daniel Baker of the University of Colorado.
”[35]
Were there any others which
aren't listed here? Like the 2012 storm, near miss...Justify
paragraph margins.
|
|
2012—present
|
47.
Miscellaneous
|
Although we're apparently in a
solar minimum at the time of this writing, I have no doubt
overlooked many solar geomagnetic events, due to the human
limitations of this researcher. As such, I have probably
underestimated the probability estimate of another
“Carrington−class” geomagnetic event.
|
Image 6. Aurora Borealis,
at night: The Northern Lights[80]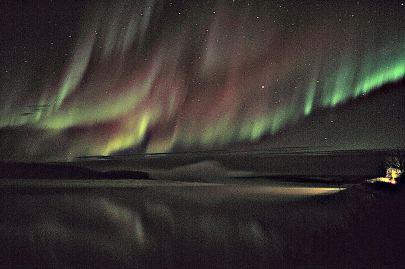
4.
References
cited in this paper [PART
I. Threats/dangers posed...(continued)]
[1]
“A Perfect Solar Superstorm: The 1859 Carrington Event: The
solar storm that hit Earth last Thursday delivered only a glancing
blow, but in 1859 the planet wasn’t so lucky.,” by
Christopher Klein, HISTORY,
14 March 2012, Updated: 22 August 2018,
LINK:
https://www.History.com/news/a−perfect−solar−superstorm−the−1859−carrington−event
Small
'Fair Use' Quote: “In cities across America, people stood
in the streets and gazed up at the heavenly pyrotechnics. In Boston,
some even caught up on their reading, taking advantage of the
celestial fire to peruse the local newspapers.”
[2]
“What If the Biggest Solar Storm on Record Happened Today?:
Repeat of 1859 Carrington Event would devastate modern world, experts
say.,” by Richard A. Lovett, National
Geographic, 04
March 2011,
LINK:
https://www.NationalGeographic.com/news/2011/3/110302−solar−flares−sun−storms−earth−danger−carrington−event−science
Small
'Fair Use' Quote: “The flares were so powerful that "people
in the northeastern U.S. could read newspaper print just from the
light of the aurora," Daniel Baker, of the University of
Colorado's Laboratory for Atmospheric and Space Physics, said at a
geophysics meeting last December.”
[3]
“Here's What Would Happen if a Solar Storm Wiped Out Technology
as We Know It,” by Peter Dockrill, Science
Alert, 21
June 2018, LINK:
https://www.ScienceAlert.com/here−s−what−would−happen−if−solar−storm−wiped−out−technology−geomagnetic−carrington−event−coronal−mass−ejection
[4]
“150 Years Ago: The Worst Solar Storm Ever,” by Robert
Roy Britt, SPACE.com,
02 September 2009,
LINK:
https://www.Space.com/7224−150−years−worst−solar−storm.html
[5]
“What Was The Carrington Event?,” by Fraser Cain,
UNIVERSE TODAY, 17
January 2017,
LINK:
https://www.UniverseToday.com/132890/what−was−the−carrington−event
LINK:
https://www.YouTube.com/watch?v=uAuyv9TCThI
[6]
“A Super Solar Flare,” NASA
SCIENCE, 06
May 2008,
LINK:
https://Science.Nasa.gov/science−news/science−at−nasa/2008/06may_carringtonflare
[7]
“A massive solar storm could wipe out almost all of our modern
technology — and we'd have just hours to prepare,” by
Rafi Letzter, BUSINESS INSIDER,
06 September 2016,
LINK:
https://www.BusinessInsider.com/massive−1859−solar−storm−telegraph−scientists−2016−9
[8]
“The Electric Storm of November 1882,” by Jeffrey J.
Love, Space Weather,
Volume 16, Issue 1,
pp. 37−46, January 2018, DOI: 10.1002/2017SW001795, Bibcode:
2018SpWea..16...37L,
LINK:
https://ui.adsabs.harvard.edu/abs/2018SpWea..16...37L
LINK:
https://ui.adsabs.harvard.edu/abs/2018SpWea..16...37L/abstract
LINK:
https://doi.org/10.1002%2F2017SW001795
LINK:
https://agupubs.onlinelibrary.wiley.com/doi/abs/10.1002/2017SW001795
LINK:
https://agupubs.onlinelibrary.wiley.com/doi/full/10.1002/2017SW001795
[9]
“On the Intensity of the Magnetic Superstorm of September
1909,” by Love, Jeffrey J.; Hayakawa, Hisashi; Cliver, Edward
W., Space Weather,
Volume 17, Issue 1,
pp. 37−45, January 2019, DOI: 10.1029/2018SW002079 Bibcode:
2019SpWea..17...37L,
LINK:
https://ui.adsabs.harvard.edu/abs/2019SpWea..17...37L
LINK:
https://ui.adsabs.harvard.edu/abs/2019SpWea..17...37L/abstract
LINK:
https://doi.org/10.1029%2F2018SW002079
LINK:
https://agupubs.onlinelibrary.wiley.com/doi/full/10.1029/2018SW002079
[10]
“Low−latitude auroras: the magnetic storm of 14−15
May 1921,”
by Silverman, S. M.; Cliver, E. W., Journal
of Atmospheric and Solar−Terrestrial Physics,
Volume 63, Issue 5, p.
523−535, March 2001, DOI: 10.1016/S1364−6826(00)00174−7,
Bibcode: 2001JASTP..63..523S,
LINK:
https://ui.adsabs.harvard.edu/abs/2001JASTP..63..523S
LINK:
https://ui.adsabs.harvard.edu/abs/2001JASTP..63..523S/abstract
LINK:
https://doi.org/10.1016%2FS1364−6826%2800%2900174−7
LINK:
https://www.ScienceDirect.com/science/article/pii/S1364682600001747?via%3Dihub
[11]
“Aurora Borealis Startles Europe; People Flee in Fear, Call
Firemen,” THE NEW YORK TIMES,
26
January 1938. p. 25, LINK: https://archive.is/F7WqI
LINK:
https://archive.is/F7WqI/f14f5906c0c01e515df2ed70c723d92e68c552bc.jpg
LINK:
http://www.DefendingTheBride.com/ss/day/1938h74.jpg
[12]
“A Large Sunspot,” Nature,
volume 141, page 156,
22 January 1938,
LINK:
https://www.Nature.com/articles/141156b0
[13]
“The Geomagnetic Blitz of September 1941,” by Jeffrey J.
Love and Pierdavide Coïsson,
Earth
& Space Science News, 15
September 2016, LINK:
https://doi.org/10.1029%2F2016EO059319
LINK:
https://eos.org/features/the−geomagnetic−blitz−of−september−1941
[14]
“Solar Cosmic Rays of February, 1956 and Their Propagation
through Interplanetary Space,” by Meyer, P.; Parker, E. N.;
Simpson, J. A., Physical Review,
vol. 104, Issue 3, pp.
768−783, November 1956, DOI: 10.1103/PhysRev.104.768, Bibcode:
1956PhRv..104..768M,
LINK:
https://ui.adsabs.harvard.edu/abs/1956PhRv..104..768M
LINK:
https://ui.adsabs.harvard.edu/abs/1956PhRv..104..768M/abstract
LINK:
https://doi.org/10.1103%2FPhysRev.104.768
LINK:
https://journals.aps.org/pr/abstract/10.1103/PhysRev.104.768
[15]
“Solar cosmic rays during the extremely high ground level
enhancement on 23 February 1956,” by A. Belov, E. Eroshenko, H.
Mavromichalaki, C. Plainaki, and V. Yanke, Annales
Geophysicae, 23,
2281–2291, 2005 [SRef−ID: 1432−0576/ag/2005−23−2281],
15 September 2005, DOI: 10.5194/angeo−23−2281−2005
Bibcode: 2005AnGeo..23.2281B,
LINK:
https://ui.adsabs.harvard.edu/abs/2005AnGeo..23.2281B
LINK:
https://ui.adsabs.harvard.edu/abs/2005AnGeo..23.2281B/abstract
LINK:
https://www.ann−geophys.net/23/2281/2005/angeo−23−2281−2005.pdf
LINK:
https://doi.org/10.5194%2Fangeo−23−2281−2005
LINK:
https://www.ann−geophys.net/23/2281/2005/
[16]
“Ionospheric Weather During Five Extreme Geomagnetic
Superstorms Since IGY Deduced With the Instantaneous Global Maps
GIM−foF2,” by Stanislawska, Iwona; Gulyaeva, Tamara L.;
Grynyshyna−Poliuga, Oksana; Pustovalova, Ljubov V., Space
Weather, Volume
16, Issue 12, pp. 2068−2078, December 2018, DOI:
10.1029/2018SW001945 Bibcode: 2018SpWea..16.2068S,
LINK:
https://ui.adsabs.harvard.edu/abs/2018SpWea..16.2068S
LINK:
https://ui.adsabs.harvard.edu/abs/2018SpWea..16.2068S/abstract
LINK:
https://doi.org/10.1029%2F2018SW001945
LINK:
https://agupubs.onlinelibrary.wiley.com/doi/abs/10.1029/2018SW001945
[17]
“The May 1967 great storm and radio disruption event: Extreme
space weather and extraordinary responses,” by Knipp, D. J.;
Ramsay, A. C.; Beard, E. D.; Boright, A. L.; Cade, W. B.; Hewins, I.
M.; McFadden, R. H.; Denig, W. F.; Kilcommons, L. M.; Shea, M. A.;
Smart, D. F., Space Weather,
Volume 14, Issue 9,
pp. 614−633, September 2016, DOI: 10.1002/2016SW001423 Bibcode:
2016SpWea..14..614K,
LINK:
https://ui.adsabs.harvard.edu/abs/2016SpWea..14..614K
LINK:
https://ui.adsabs.harvard.edu/abs/2016SpWea..14..614K/abstract
LINK:
https://doi.org/10.1002%2F2016SW001423
LINK:
https://agupubs.onlinelibrary.wiley.com/doi/full/10.1002/2016SW001423
[18]
“On the Little−Known Consequences of the 4 August 1972
Ultra−Fast Coronal Mass Ejecta: Facts, Commentary, and Call to
Action,” by Delores J. Knipp, Brian J. Fraser , M. A. Shea, D.
F. Smart, Space Weather,
Volume 16, Issue 11,
November 2018, Pages 1635−1643, DOI: 10.1029%2F2018SW002024,
LINK:
https://doi.org/10.1029%2F2018SW002024
LINK:
https://agupubs.onlinelibrary.wiley.com/doi/full/10.1029/2018SW002024
[19]
“BIGGEST SOLAR X−RAY FLARE ON RECORD – X20,”
SOHO (Solar and Heliospheric
Observatory), 19
September 2019 − Mission Day: 8693 − DOY: 262, Press
contacts: Dr. Paal Brekke, pbrekke@esa.nascom.nasa.gov;
Tel: 301−286−6903, Dr. Bernhard Fleck,
bfleck@esa.nascom.nasa.gov
; Tel: 301−286−4098, Dr. Joe Gurman,
gurman@eitv.nascom.nasa.gov
; Tel : 301−286−4767
LINK:
https://sohowww.nascom.nasa.gov/hotshots/X17
[20]
“7 times solar storms have affected Earth,” by Matt
Liddy, ABC NEWS, 01
April 2015,
LINK:
https://www.abc.net.au/news/2014−09−12/how−solar−storms−affect−earth/5740454
Small
'Fair Use' Quote:
“Communications networks around the globe were affected,
prompting speculation the Kremlin was jamming radio signals, while
short−wave radio frequencies used by commercial pilots also
suffered fadeouts.”
[21]
“Solar storms halt stock market as computers crash,” by
Leigh Dayton,
NewScientist,
09 September 1989,
LINK:
https://NewScientist.com/article/mg12316812−400−solar−storms−halt−stock−market−as−computers−crash
[22]
“Solar flare impacts microchips, August 16, 1989,” by
Suzanne Deffree, EDN Network,
16 August 2019, LINK:
https://www.EDN.com/electronics−blogs/edn−moments/4394205/Solar−flare−impacts−microchips−−August−16−−1989
[23]
“Storms from the Sun: The Emerging Science of Space Weather,”
by Michael J. Carlowicz, Ramon E. Lopez, Publisher: Joseph Henry
Press, 2002 − Science
− 234 pages (as listed in Google Books), or 256 pages (as
listed in Amazon), ISBN−10: 0309076420; ISBN−13:
978−0309076425,
LINK:
https://books.google.com.au/books?id=RJO_IsMDiccC&q=1882#v=onepage&q=1989&f=false
LINK:
https://www.Amazon.com/Storms−Sun−Emerging−Science−Weather/dp/0309076420
[24]
“Midlatitude postsunset plasma bubbles observed over Europe
during intense storms in April 2000 and 2001,” by
Katamzi−Joseph, Zama Thobeka; Habarulema, John Bosco;
Hernández−Pajares, Manuel;
Space
Weather, Volume
15, Issue 9, pp. 1177−1190;
DOI: 10.1002/2017SW001674, Bibcode: 2017SpWea..15.1177K,
LINK:
https://ui.adsabs.harvard.edu/abs/2017SpWea..15.1177K
LINK:
https://ui.adsabs.harvard.edu/abs/2017SpWea..15.1177K/abstract
LINK:
https://doi.org/10.1002%2F2017SW001674
LINK:
https://agupubs.onlinelibrary.wiley.com/doi/full/10.1002/2017SW001674
LINK:
https://hdl.handle.net/2117%2F115052
LINK:
https://upcommons.upc.edu/handle/2117/115052
[25]
“SOLAR FLARE BIGGEST SINCE '89 − THE EVENT WAS FOLLOWED
BY A BLAST OF MILLIONS OF RADIOACTIVE PARTICLES, WHICH WILL BE SEEN
AS NORTHERN LIGHTS ON EARTH TONIGHT,” by Frank D. Roylance,
Contra Costa Times
(Walnut Creek, CA), Page:
A12, Section: news (431 Words), 15 July 2000, LINK:
https://InfoEeb.newsbank.com/apps/news/document−view?p=WORLDNEWS&docref=news/1064A3E55B815DA8&f=basic
[26]
“The effect of the July 14, 2000 “Bastille Day”
solar flare event on >70 MeV galactic cosmic rays observed at V1
and V2 in the distant heliosphere,” by W. R. Webber F. B.
McDonald J. A. Lockwood B. Heikkila, Geophysical
Research Letters, Volume
29, Issue 10, pp. 1377–1380, 21 May 2002,
DOI:10.1029/2002GL014729, LINK:
https://doi.org/10.1029/2002GL014729
LINK:
https://agupubs.onlinelibrary.wiley.com/doi/full/10.1029/2002GL014729
[27]
“Service Assessment: Intense Space Weather Storms October 19 –
November 07, 2003,” by Christopher Balch Team Leader (Lead
Space Weather Forecaster, NOAA; Space Environment Center (SEC),
Boulder, Colorado), Bill Murtagh (Lead Author, Space Weather
Forecaster, NOAA Space; Environment Center, Boulder, Colorado), et.
al., NOAA (National Oceanic and
Atmospheric Administration, Silver Spring, MD),
Technical Memorandum,
U.S. Department of Commerce, April 2004,
LINK:
https://www.Weather.gov/media/publications/assessments/SWstorms_assessment.pdf
LINK:
https://Repository.Library.NOAA.gov/view/noaa/6995
[28]
“HALLOWEEN SPACE WEATHER STORMS OF 2003,” by LCDR Michael
Weaver (NOAA editor)
William
Murtagh (editor), Christopher Balch, et. al., NOAA
(National Oceanic and Atmospheric Administration, Space Environment
Center, Boulder, Colorado), NOAA
Technical Memorandum OAR SEC−88, June 2004, LINK:
https://web.archive.org/web/20110728172705/http://www.swpc.noaa.gov/Services/HalloweenStorms_assessment.pdf
LINK:
ftp://ftp.Library.NOAA.gov/noaa_documents.lib/OAR/OAR_SEC/TM_OAR_SEC/TM_OAR_SEC_88.pdf
[29]
“Modeling polar region atmospheric ionization induced by the
giant solar storm on 20 January 2005,” by Mitthumsiri, W.;
Seripienlert, A.; Tortermpun, U.; Mangeard, P. −S.; Sáiz,
A.; Ruffolo, D.; Macatangay, R., Journal
of Geophysical Research: Space Physics, Volume
122, Issue 8, pp. 7946−7955, August 2017, DOI:
10.1002/2017JA024125, Bibcode: 2017JGRA..122.7946M,
LINK:
https://ui.adsabs.harvard.edu/abs/2017JGRA..122.7946M
LINK:
https://ui.adsabs.harvard.edu/abs/2017JGRA..122.7946M/abstract
LINK:
https://doi.org/10.1002%2F2017JA024125
LINK:
https://agupubs.onlinelibrary.wiley.com/doi/full/10.1002/2017JA024125
[30]
“Giant Ground Level Enhancement of Relativistic Solar Protons
on 2005 January 20. I. Spaceship Earth Observations,” by
Bieber, J. W.; Clem, J.; Evenson, P.; Pyle, R.; Sáiz, A.;
Ruffolo, D., The Astrophysical
Journal, Volume
771, Issue 2, article id. 92, 13 pp. (2013), July 2013 DOI:
10.1088/0004−637X/771/2/92, Bibcode: 2013ApJ...771...92B,
LINK:
https://ui.adsabs.harvard.edu/abs/2013ApJ...771...92B
LINK:
https://ui.adsabs.harvard.edu/abs/2013ApJ...771...92B/abstract
LINK:
https://doi.org/10.1088%2F0004−637X%2F771%2F2%2F92
LINK:
https://iopscience.iop.org/article/10.1088/0004−637X/771/2/92
[31]
“A major solar eruptive event in July 2012: Defining extreme
space weather scenarios,” by Baker, D. N.; Li, X.; Pulkkinen,
A.; Ngwira, C. M.; Mays, M. L.; Galvin, A. B.; Simunac, K. D. C.,
Space Weather, Volume
11, Issue 10, pp. 585−591, October 2013 DOI: 10.1002/swe.20097
Bibcode: 2013SpWea..11..585B, LINK:
https://ui.adsabs.harvard.edu/abs/2013SpWea..11..585B
LINK:
https://ui.adsabs.harvard.edu/abs/2013SpWea..11..585B/abstract
LINK:
https://doi.org/10.1002%2Fswe.20097
LINK:
https://agupubs.onlinelibrary.wiley.com/doi/full/10.1002/swe.20097
[32]
“Simulation of the 23 July 2012 extreme space weather event:
What if this extremely rare CME was Earth directed?,” by
Ngwira, Chigomezyo M.; Pulkkinen, Antti; Leila Mays, M.; Kuznetsova,
Maria M.; Galvin, A. B.; Simunac, Kristin; Baker, Daniel N.; Li,
Xinlin; Zheng, Yihua; Glocer, Alex, Space
Weather, Volume
11, Issue 12, pp. 671−679, December 2013,
DOI: 10.1002/2013SW000990, Bibcode: 2013SpWea..11..671N,
LINK:
https://ui.adsabs.harvard.edu/abs/2013SpWea..11..671N
LINK:
https://ui.adsabs.harvard.edu/abs/2013SpWea..11..671N/abstract
LINK:
https://doi.org/10.1002%2F2013SW000990
LINK:
https://agupubs.onlinelibrary.wiley.com/doi/full/10.1002/2013SW000990
[33]
“Observations of an extreme storm in interplanetary space
caused by successive coronal mass ejections,” by Ying D. Liu,
Janet G. Luhmann, Primož Kajdič, Emilia K. J. Kilpua, Noé
Lugaz, Nariaki V. Nitta, Christian Möstl, Benoit Lavraud, Stuart
D. Bale, Charles J. Farrugia, Antoinette B. Galvin, Nature
Communications,
Volume 5, id. 3481 (2014), 23 May 2014, DOI: 10.1038/ncomms4481, Cite
as: arXiv:1405.6088 [physics.space−ph], (or arXiv:1405.6088v1
[physics.space−ph] for this version),
LINK:
https://ui.adsabs.harvard.edu/abs/2014NatCo...5.3481L
LINK:
https://ui.adsabs.harvard.edu/abs/2014NatCo...5.3481L/abstract
LINK:
https://arxiv.org/abs/1405.6088
LINK:
https://ui.adsabs.harvard.edu/abs/2014NatCo...5E3481L
LINK:
https://doi.org/10.1038%2Fncomms4481
LINK:
https://www.nature.com/articles/ncomms4481
[34]
“Carrington−class CME Narrowly Misses Earth,” by
Dr. Tony Phillips, NASA SCIENCE,
02
May 2014, LINK:
https://Science.NASA.gov/science−news/science−at−nasa/2014/02may_superstorm
[35]
“Near Miss: The Solar Superstorm of July 2012,” by Dr.
Tony Phillips, NASA SCIENCE,
23 July
2014, LINK:
https://Science.NASA.gov/science−news/science−at−nasa/2014/23jul_superstorm
[36]
“The 1859 Solar−Terrestrial Disturbance And the Current
Limits of Extreme Space Weather Activity,” by Cliver, E.W.;
Svalgaard, L., Solar Physics,
Volume 224, Issue 1−2,
pp. 407−422, 08 October 2004, DOI: 10.1007/s11207−005−4980−z,
Bibcode: 2004SoPh..224..407C,
LINK:
http://www.leif.org/research/1859%20Storm%20−%20Extreme%20Space%20Weather.pdf
LINK:
https://www.leif.org/research/1859%20Storm%20−%20Extreme%20Space%20Weather.pdf
LINK:
https://ui.adsabs.harvard.edu/abs/2004SoPh..224..407C
LINK:
https://ui.adsabs.harvard.edu/abs/2004SoPh..224..407C/abstract
LINK:
https://doi.org/10.1007%2Fs11207−005−4980−z
LINK:
https://link.springer.com/article/10.1007%2Fs11207−005−4980−z
EDITOR'S
NOTE:
“TABLE V” of Cliver's paper, here, e.g., “The 25
largest geomagnetic storms based on the Aa∗m index,
1868–1998.,” lists about 25 storms, a few of which may be
missing above, so I'm using Cliver's data to supplement my own
research.
[“Abstract.
It is generally
appreciated that the September 1859 solar–terrestrial
disturbance, the first
recognized space weather event, was exceptionally large.
How large and how exceptional? To answer
these questions, we compiled rank order lists of the
various measures of solar−induced disturbance for
events from 1859 to the present. The parameters
considered included: magnetic crochet amplitude,
solar
energetic proton fluence (McCracken et
al., 2001a),
Sun–Earth disturbance transit time, geomagnetic
storm intensity, and low−latitude auroral extent.
While the 1859 event has close rivals or superiors
in each of the above categories of space weather
activity, it is the only documented event of the last
~150 years that appears at or near the top of all of the
lists. Taken together, the top−ranking events in
each
of the disturbance categories comprise a set of benchmarks for
extreme space weather activity.”]
[37]
“The 1859 space weather event revisited: limits of extreme
activity,” by Edward W. Cliver and William F. Dietrich, Journal
of Space Weather and Space Climate, Volume
3, Article Number: A31, 21 October 2013, DOI: 10.1051/swsc/2013053,
LINK: https://doi.org/10.1051/swsc/2013053
LINK:
https://www.swsc−journal.org/articles/swsc/full_html/2013/01/swsc130015/swsc130015.html
Small
'Fair Use' Quote:
“The solar flare on 1 September 1859 and its associated
geomagnetic storm remain the standard for an extreme
solar−terrestrial event. The most recent estimates of the flare
soft X−ray (SXR) peak intensity and Dst magnetic storm index
for this event are: SXR class = X45 (±5) (vs. X35 (±5)
for the 4 November 2003 flare) and minimum Dst = −900 (+50,
−150) nT (vs. −825 to −900 nT for the great storm
of May 1921).”
[38]
“Interplanetary conditions leading to superintense geomagnetic
storms (Dst ≤ −250 nT) during solar cycle 23,” by E.
Echer, W.D. Gonzalez, B.T. Tsurutani, Geophysical
Research Letters, Volume
35, Issue 6, 15 February 2008, DOI: 10.1029/2007GL031755, LINK:
https://doi.org/10.1029/2007GL031755
LINK:
https://agupubs.onlinelibrary.wiley.com/doi/abs/10.1029/2007GL031755
LINK:
https://agupubs.onlinelibrary.wiley.com/doi/full/10.1029/2007GL031755
[39]
“Probability of catastrophic geomagnetic storm lower than
estimated,” ScienceDaily,
March 12, 2019, LINK:
https://www.ScienceDaily.com/releases/2019/03/190312103717.htm
Small
'Fair Use' Quote:
“It is estimated that the Dst index associated with the
Carrington Event had a value of approximately −850 nT.”
[40]
“Probability estimation of a Carrington−like geomagnetic
storm,” by David Moriña, Isabel Serra, Pedro Puig &
Álvaro Corral, Scientific
Reports,
volume 9, Article number: 2393, 20 February 2019, DOI:
10.1038/s41598−019−38918−8, LINK:
https://doi.org/10.1038/s41598−019−38918−8
LINK:
https://www.Nature.com/articles/s41598−019−38918−8
Small
'Fair Use' Quote:
“The Carrington event is the largest known example of
geomagnetic storm, occurred by the end of August and early September
1859 and is associated to a minimum Dst under −850−nT.”
[41]
“Extreme space weather: impacts on engineered systems and
infrastructure,” © Royal
Academy of Engineering [small
quote used under Fair Use], ISBN 1−903496−95−0,
February 2013, Published by:
Royal Academy of Engineering, Prince Philip House, 3
Carlton House Terrace, London SW1Y 5DG,
LINK:
https://www.raeng.org.uk/spaceweather
LINK:
https://www.raeng.org.uk/publications/reports/space−weather−full−report
LINK:
http://www.ProteccionCivil.org/catalogo/naturales/climaespacial/jt_clima_espacial_2013/presentaciones/p42.pdf
LINK:
https://web.Archive.org/web/20130210183311/http://www.raeng.org.uk/news/publications/list/reports/space_weather_full_report_final.pdf
Small
'Fair Use' Quote:
“Another significant event was the geomagnetic storm of 8−9
February 1986, which saw Dst drop to −301 nT. This event is
significant because of its timing very close to sunspot minimum,
which nominally occurred in September 1986, but which would have been
in March 1986 if the February storm had not occurred. This storm
shows that extreme events can occur at any phase of the solar cycle
and it is unwise to focus mitigation efforts only around solar
maximum.” (pp.17—18)
[42]
“Repercussions of Solar High Energy Protons on Ozone Layer
during Super Storms,” by Asheesh Bhargawa, M. Yakub, and A. K.
Singh, Research in Astronomy and
Astrophysics,
Volume
19, Number 1, 22
December 2017; accepted 07 June 2018,
LINK:
http://www.raa−journal.org/docs/papers_accepted/2017−0267.pdf
LINK:
https://iopscience.iop.org/article/10.1088/1674−4527/19/1/2/pdf
LINK:
https://www.ResearchGate.net/publication/326345647_Repercussions_of_Solar_High_Energy_Protons_on_Ozone_Layer_during_Super_Storms
Small
'Fair Use' Quote:
“We have plotted all seven storm events together in Figure 1.
The first case of super storm was recorded on February 09, 1986 and
was associated with a number of solar flares of low intensities
occurred. The peak of the storm was observed at 01:00 UT on February
09. By chance this storm was the largest recorded storm, since 1960
and the eighth largest since 1932 (Allen 1986). Two other factors
made this storm particularly unusual (i) it occurred near the minimum
of the Sun’s activity cycle; and (ii) it was apparently caused
by flares that could be described as moderate to large. The initial
phase of this storm was started on 06 Feb at 21:00 UT and continued
till Feb 07 till 07:00 UT and the main phase occurred with its
minimum value (Dst index −307 nT) on Feb 09 at 01:00 UT, then
it reached to its recovery phase and this phase continued till Feb 13
at 23:00 UT.”
[43]
“How good is the relationship of solar and interplanetary
plasma parameters with geomagnetic storms?,” by R.P. Kane,
JOURNAL OF GEOPHYSICAL RESEARCH,
VOL. 110, A02213, 25
February 2005, DOI:10.1029/2004JA010799,
LINK:
http://dx.doi.org/10.1029/2004JA010799
LINK:
https://agupubs.OnlineLibrary.wiley.com/doi/full/10.1029/2004JA010799
LINK:
https://www.ResearchGate.net/publication/41388470_How_good_is_the_relationship_of_solar_and_interplanetary_plasma_parameters_with_geomagnetic_storms
Selected
Data from Table 1:
Date:
Dst, −nT:
13.03.1989 589
20.10.1989 268
17.11.1989 266
Small
'Fair Use' Quote:
“There were two giant events in recent times (Halloween events
A: 29 October 2003, Dst −401 nT, and B: 20 November 2003, Dst
−472 nT, marked in Figure 1 as solid big circles) and the
earlier largest event of 13 March 1989 (Dst −589 nT).”
[44]
“Anomalous geomagnetic storm of 21–22 January 2005: A
storm main phase during northward IMFs,” by A.M. Du, B.T.
Tsurutani, W. Sun, Journal of Geophysical
Research: Space Physics, 28
October 2008 DOI: 10.1029/2008JA013284, LINK:
https://doi.org/10.1029/2008JA013284
LINK:
https://agupubs.OnlineLibrary.wiley.com/doi/full/10.1029/2008JA013284
Small
'Fair Use' Quote:
“The major (minimum Dst = −105 nT) magnetic storm which
occurred on 21–22 January 2005 is highly anomalous because the
storm main phase (identified by the SYM−H indices) developed
during northward interplanetary magnetic fields (IMFs). We believe
this to be the first event of its type to be reported in the
literature.”
[45]
Halo CME [Twitter account: @halocme ] “Solar
physicist (alum UtkyAst),” 19
July 2017
Link:
https://pic.twitter.com/cpbmn2ro0q
Link:
https://Twitter.com/halocme/status/887825185373421568
Link:
https://Twitter.com/halocme/status/887825185373421568/photo/1
Small
'Fair Use' Quote: “Summary
of the consequences of the Bastille Day (14 July) eruption, which
also produced a M2.4 solar flare. Min Dst −69 nT, Max Kp 6.0
(G2).pic.twitter.com/cpbmn2ro0q”
[46]
“Estimating the solar wind conditions during an extreme
geomagnetic storm: a case study of the event that occurred on March
13–14, 1989,” by Tsutomu Nagatsuma, Ryuho Kataoka, &
Manabu Kunitake, Earth, Planets and Space,
volume 67, Article number: 78, 27
May 2015,
DOI:
org/10.1186/s40623−015−0249−4, LINK:
https://doi.org/10.1186/s40623−015−0249−4
LINK:
https://Earth−Planets−Space.SpringerOpen.com/articles/10.1186/s40623−015−0249−4
Small
'Fair Use' Quote: “Previous
studies have suggested that solar flares of modest intensity and
duration can produce severe geomagnetic storms. In the case of the
solar sources of the Bastille geomagnetic storm that occurred on July
15–17, 2000, with a Dst minimum of −301 nT, the duration
of the solar flare was 40 min (Andrews 2001). In case of the solar
sources of the Halloween geomagnetic storm that occurred November
20–21, 2003, with a Dst minimum of −422 nT, three
long−durational event (LDE) flares with intensities less than
M5.0 were reported (e.g., Gopalswamy et al. 2005). This demonstrates
that a strong geoeffective solar wind driver can be produced from a
solar flare modest of intensity and duration.”
[47]
“SUN−TO−EARTH MHD SIMULATION OF THE 14 JULY 2000
“BASTILLE DAY” ERUPTION,” by Tibor Török,
Cooper Downs, Jon A. Linker, R. Lionello, Viacheslav S. Titov, Zoran
Mikić, Pete Riley, Ronald M. Caplan, and Janvier Wijaya, The
Astrophysical Journal, Volume
856, Number 1, 20 March 2019, Published online: 27 March 2018, DOI:
10.3847/1538−4357/aab36d,
LINK:
https://www.ncbi.nlm.nih.gov/pmc/articles/PMC5882495/
LINK:
https://dx.doi.org/10.3847%2F1538−4357%2Faab36d
LINK:
https://iopscience.iop.org/article/10.3847/1538−4357/aab36d
LINK:
https://iopscience.iop.org/article/10.3847/1538−4357/aab36d/pdf
Small
'Fair Use' Quote: “The
Bastille Day eruption occurred on 14 July 2000 in active region (AR)
NOAA 9077. It was one of the largest events during the solar cycle
23. The eruption has been extensively studied, and many articles have
been published, including a special volume of Solar Physics (2001,
Vol. 204, Issue 1–2)...The MC [magnetic cloud], carrying a
strong southward magnetic field component (“negative Bz”),
produced a very strong geomagnetic storm with a minimum geomagnetic
storm index, Dst, lower than −300 nT (Lepping et al. 2001).”
[48]
“The Bastille day Magnetic Clouds and Upstream Shocks:
Near−Earth Interplanetary Observations,”
by
R.P. Lepping, D.B. Berdichevsky, L.F. Burlaga, A.J. Lazarus, J.
Kasper, M.D. Desch, C.−C. Wu, D.V. Reames, H.J. Singer, C.W.
Smith, K.L. Ackerson, Solar Physics,
December 2001, Volume 204, Issue 1–2, pp 285–303, DOI:
org/10.1023/A:1014264327855,
LINK:
https://doi.org/10.1023/A:1014264327855
LINK:
https://Link.Springer.com/article/10.1023/A:1014264327855
Small
'Fair Use' Quote: “The
energetic charged particle, interplanetary magnetic field, and plasma
characteristics of the `Bastille Day' shock and ejecta/magnetic cloud
events at 1 AU occurring over the days 14–16 July 2000 are
described...Overall this dramatic series of interplanetary events
caused a large multi−phase magnetic storm with min Dst lower
than −300 nT.”
[49]
“1 in 8 Chance of Catastrophic Solar Megastorm by 2020,”
by Adam Mann, WIRED,
29
February 2012, LINK:
https://www.Wired.com/2012/02/massive−solar−flare
[50]
“On the probability of occurrence of extreme space weather,”
by Pete Riley, Space Weather,
10(2):2012, 02 February 2012, DOI: 10.1029/2011SW000734,
LINK:
https://doi.org/10.1029/2011SW000734
LINK:
https://www.ResearchGate.net/publication/258723347_On_the_probability_of_occurrence_of_extreme_space_weather
Small
'Fair Use' Quote: “By
virtue of their rarity, extreme space weather events, such as the
Carrington event of 1859, are difficult to study, their rates of
occurrence are difficult to estimate, and prediction of a specific
future event is virtually impossible. Additionally, events may be
extreme relative to one parameter but normal relative to others. In
this study, we analyze several measures of the severity of space
weather events (flare intensity, coronal mass ejection speeds, Dst,
and >30 MeV proton fluences as inferred from nitrate records) to
estimate the probability of occurrence of extreme events. By showing
that the frequency of occurrence scales as an inverse power of the
severity of the event, and assuming that this relationship holds at
higher magnitudes, we are able to estimate the probability that an
event larger than some criteria will occur within a certain interval
of time in the future. For example, the probability of
another Carrington event (based on Dst < −850 nT) occurring
within the next decade is ~12%.
We also identify and address several limitations with this approach.
In particular, we assume time stationarity, and thus, the effects of
long−term space climate change are not considered. While this
technique cannot be used to predict specific events, it may
ultimately be useful for probabilistic forecasting.”
[51]
“The Day the Sun Brought Darkness,” by Dr. Sten Odenwald,
NASA Astronomer, NASA,
March 13, 2009, Last Updated: Aug. 7, 2017 (Editor: Holly Zell),
LINK:
https://www.NASA.gov/topics/earth/features/sun_darkness.html
Small
'Fair Use' Quote: “On
March 13, 1989 the entire province of Quebec, Canada suffered an
electrical power blackout. Hundreds of blackouts occur in some part
of North America every year. The Quebec Blackout was different,
because this one was caused by a solar storm! [] On Friday March 10,
1989 astronomers witnessed a powerful explosion on the sun. Within
minutes, tangled magnetic forces on the sun had released a
billion−ton cloud of gas. It was like the energy of thousands
of nuclear bombs exploding at the same time. The storm cloud rushed
out from the sun, straight towards Earth, at a million miles an hour.
The solar flare that accompanied the outburst immediately caused
short−wave radio interference, including the jamming of radio
signals from Radio Free Europe into Russia. It was thought that the
signals had been jammed by the Kremlin, but it was only the sun
acting up!”
[52]
“The Maunder Minimum and Climate Change: Have Historical
Records Aided Current Research?,” by John E. Beckman, and
Terence J. Mahoney, (Instituto de Astrofísica de Canarias,
E−38200 La Laguna, Tenerife, Spain) Astronomical
Society of the Pacific, ASP
Conference Series, Vol. 153 (Library and Information Services in
Astronomy III, Editors: U. Grothkopf, H. Andernach, S.
Stevens−Rayburn, and M. Gomez, Electronic Editor: H. E. Payne),
Date: 1998,
LINK:
http://www.stsci.edu/stsci/meetings/lisa3/beckmanj.html
[53]
“Are We Headed Towards Another Deep Solar Minimum?,” by
David Dickinson,
UNIVERSE
TODAY: Space and astronomy news,
22 May 2018,
LINK:
https://www.UniverseToday.com/139189/are−we−headed−towards−another−deep−solar−minimum
[54]
“Is the Sun heading for another Maunder Minimum? −
Precursors of the grand solar minima,” by
Miyahara,
H.; Kitazawa, K.; Nagaya, K.; Yokoyama, Y.; Matsuzaki, H.; Masuda,
K.; Nakamura, T.; Muraki, Y., Journal of Cosmology, vol.
8, p. 1970−1982, June 2010, Bibliographic Code:
2010JCos....8.1970M,
LINK:
http://adsabs.harvard.edu/abs/2010JCos....8.1970M
LINK:
https://ui.adsabs.harvard.edu/abs/2010JCos....8.1970M
[55]
“Is Earth's Magnetic Field Flipping Soon?,” by Elizabeth
Howell, SPACE.com,
30 January 2019,
LINK:
https://www.Space.com/43173−earth−magnetic−field−flips−when.html
Small
'Fair Use' Quote: “Earth's
north magnetic pole is so out of whack that scientists need to update
the global magnetic−field model they released only four years
ago. Could that be a sign that the magnetic pole will flip soon? []
The World Magnetic Model (WMM) — the name of the updated
representation of the magnetic field of Earth — is expected to
be released no earlier than Jan. 30. That's about two weeks later
than planned, with the delay due to the government shutdown,
according to a report in Nature. [] The magnetic pole is moving
erratically out of the Canadian Arctic and toward Siberia so
unpredictably that it took scientists by surprise. That 2015 update
was supposed to remain valid until 2020, Arnaud Chulliat, a
geomagnetist at the University of Colorado Boulder and the National
Oceanic and Atmospheric Administration's (NOAA) National Centers for
Environmental Information, told Nature.”
[56]
“Earth's magnetic poles could start to flip. What happens
then?,” by Jonathan O'callaghan,
PHYS.ORG,
07 December 2018, LINK:
https://Phys.org/news/2018−12−earth−magnetic−poles−flip.html
Small
'Fair Use' Quote: “As
Earth's magnetic shield fails, so do its satellites. First, our
communications satellites in the highest orbits go down. Next,
astronauts in low−Earth orbit can no longer phone home. And
finally, cosmic rays start to bombard every human on Earth. [] This
is a possibility that we may start to face not in the next million
years, not in the next thousand, but in the next hundred. If Earth's
magnetic field were to decay significantly, it could collapse
altogether and flip polarity – changing magnetic north to south
and vice versa. The consequences of this process could be dire for
our planet. [] Most worryingly, we may be headed right for this
scenario. [] 'The geomagnetic field has been decaying for the last
3,000 years,' said Dr. Nicolas Thouveny from the European Centre for
Research and Teaching of Environmental Geosciences (CEREGE) in
Aix−en−Provence, France. 'If it continues to fall down at
this rate, in less than one millennium we will be in a critical
(period).'...'The geomagnetic field has been losing 30 percent of its
intensity in the last 3,000 years,' said Dr. Thouveny. 'From this
value, we predict it will drop to near zero in a few centuries or a
millennia.'...'This is a region where we see that satellites
consistently (experience) electronic failures,' said Prof. Finlay.
'And we don't understand where this weak field region is coming from,
what's producing it, and how it might change in the future.' []
Scientists first noticed the SAA [the “South Atlantic Anomaly”]
in the 1950s, and since then it has decreased in strength by a
further 6%, as well as moving closer to the west.'”(Comments in
bracket to define “SAA”; not in original)
[57]
“Why Space Radiation Matters,” Page Editor: Kelli Mars,
NASA Official: Brian Dunbar,
NASA
(National Aeronautics and Space Administration),
Page Last Updated: June 11, 2018,
LINK:
https://www.NASA.gov/analogs/nsrl/why−space−radiation−matters
Small
'Fair Use' Quote: “Outside
the protective cocoon of the Earth’s atmosphere is a universe
full of radiation – it is all around us...Space radiation is
made up of three kinds of radiation: particles trapped in the Earth’s
magnetic field; particles shot into space during solar flares (solar
particle events); and galactic cosmic rays, which are high−energy
protons and heavy ions from outside our solar system. All of these
kinds of space radiation represent ionizing radiation...Beyond Low
Earth Orbit, space radiation may place astronauts at significant risk
for radiation sickness, and increased lifetime risk for cancer,
central nervous system effects, and degenerative diseases. Research
studies of exposure in various doses and strengths of radiation
provide strong evidence that cancer and degenerative diseases are to
be expected from exposures to galactic cosmic rays (GCR) or solar
particle events (SPE)...In addition to a protective atmosphere, we
are also lucky that Earth has a magnetic field. It shields us from
the full effects of the solar wind and GCR. Without this protection,
Earth’s biosphere might not exist as it does today, or would at
least be limited to the subsurface.”
[58]
“Is it true that the strength of the Earth's magnetic field is
decreasing? What's the effect?,” SCIENTIFIC
AMERICAN, 05 October 1998,
LINK:
https://www.ScientificAmerican.com/article/is−it−true−that−the−stren
Small
'Fair Use' Quote: “The
Earth's magnetic field is constantly changing, and the way which it
changes also changes. When describing the magnetic field of the Earth
we must specify both the direction and the intensity of the
field...At most places there has been a general decrease in the
strength over the past century, typically ten percent or so.”
[59]
“Magnetic north just changed. Here's what that means.,”
by Maya Wei−Haas,
NATIONAL
GEOGRAPHIC, 04 February
2019,
LINK:
https://www.NationalGeographic.com/science/2019/02/magnetic−north−update−navigation−maps
Small
'Fair Use' Quote: “Magnetic
north has never sat still. In the last hundred years or so, the
direction in which our compasses steadfastly point has lumbered ever
northward, driven by Earth's churning liquid outer core some 1,800
miles beneath the surface. Yet in recent years, scientists noticed
something unusual: Magnetic north's routine plod has shifted into
high gear, sending it galloping across the Northern Hemisphere—and
no one can entirely explain why. [] The changes have been so large
that scientists began working on an emergency update for the World
Magnetic Model, the mathematical system that lays the foundations for
navigation, from cell phones and ships to commercial airlines...“We
know that the pole now is moving faster than it has for decades, but
how often does that happen in the long historical record?”
inquires Geoff Reeves, a space scientist at Los Alamos National Lab.
[] “We don't have any idea. What we know is what it's doing now
is different, and that's always exciting scientifically.””
[60]
“Earth’s Magnetic North Pole Moving Towards Siberia,”
21stCenturyWire.com, 11
January 2019, LINK:
https://21stCenturyWire.com/2019/01/11/earths−magnetic−north−pole−moving−towards−siberia
Small
'Fair Use' Quote: “The
north magnetic pole sped across the International Date Line last year
at a rate of 55 km per year, more than three times as fast as it
moved before the mid−1990s. Now located in the Eastern
Hemisphere, it’s moving away from Canada and approaching
Siberia.”
[61]
“Earth's Magnetic Pole Is Wandering, Lurching Toward Siberia,”
by Laura Geggel, LiveScience,
14
January 2019, LINK:
https://www.LiveScience.com/64486−earth−magnetic−pole−moving.html
Small
'Fair Use' Quote: “News
of the magnetic north's meanderings isn't exactly new. Researchers
figured out in the 1800s that magnetic north tended to drift. Then,
in the mid−1990s, it began moving faster, from just over 9
miles (15 kilometers) a year to about 34 miles (55 km) annually,
Nature reported. In 2018, magnetic north skipped over the
International Date Line and entered the Eastern Hemisphere.”
[62]
“What would happen if the magnetic field of the Earth suddenly
changed?,” NASA,
LINK:
https://image.gsfc.NASA.gov/poetry/ask/q279.html
Small
'Fair Use' Quote: “If
the magnetic field of the Earth suddenly changed,
and this DOES happen naturally every 250,000 years or so, the
consequences would be fascinating. For life, we can see from the
fossil record that the past field changes had no significant effect
on living organisms. This is most curious because the field reversal
( North magnetic pole shifting to antarctica and the South magnetic
pole shifting to the arctic region in the Northern Hemisphere) one
might expect the field to go to zero strength for a century or so.
This would let cosmic rays freely penetrate to the Earth's surface
and cause mutations. This seems not to have had much effect in the
past, so we probably don't really know what is going on during these
field reversals. There have been a dozen of them over the last few
million years, documented in the rock which has emerged and
solidified along the mid−Atlantic Ridge where continental
plates are slowly separating. These epochs form parallel bands all
long the ridge where the rock has stored a fossilized image of the
local orientation of the Earth's magnetic field for the last few
million years.” [Emphasis added in bold for clarity, not in
original.]
[63]
“Earth’s Magnetic Field Could Take Longer to Flip Than
Previously Thought: New research suggests a polarity reversal of the
planet takes about 22,000 years, significantly longer than former
estimates,”
by
Emily Toomey, SMITHSONIAN.COM aka the Smithsonian
Institution, 07 August
2019, LINK:
https://www.SmithsonianMag.com/science−nature/earths−magnetic−field−could−take−longer−flip−previously−thought−180972843
Small
'Fair Use' Quote: ““When
the [magnetic] field is weak, which is during reversals, the
main dipole field collapses to something on the order of ten
percent of its normal strength,”
Singer says. This collapse could spell trouble for life on Earth,
since the magnetic field stabilizes ozone molecules, shielding the
planet from ultraviolet radiation.”(Emphasis added in bold and
underline for clarity, not in original.)
[64]
“Tug−of−war drives magnetic north sprint,”EUROPEAN
SPACE AGENCY, 15 May 2019, LINK:
https://www.esa.int/Our_Activities/Observing_the_Earth/Swarm/Tug−of−war_drives_magnetic_north_sprint
Small
'Fair Use' Quote: “Between 1990 and 2005 magnetic north
accelerated from its historic speed of 0–15 km a year, to its
present speed of 50–60 km a year. In late October
2017, it crossed the international date line, passing within 390 km
of the geographic pole, and is now heading south.” [Emphasis in
bold−faced underline for clarity; not in original]
[65]
“The whole atmosphere response to changes in the Earth's
magnetic field from 1900 to 2000: An example of “top−down”
vertical coupling,” by Ingrid Cnossen, Hanli Liu, Hua Lu,
American Geophysical Union, 27 June 2016, DOI:
10.1002/2016JD024890, LINK:
https://doi.org/10.1002/2016JD024890
LINK:
https://agupubs.OnlineLibrary.wiley.com/doi/full/10.1002/2016JD024890
Small
'Fair Use' Quote: “The northern magnetic pole motion has
even been speeding up since the 1970s to a speed of 40–60−km/yr
[Newitt et al., 2002; Olsen and Mandea, 2007]. At the
same time, the magnetic dipole moment has been decreasing by about
5–7% per century since 1840 [Gubbins et al., 2006;
Mandea and Purucker, 2005]. The strongest changes in the
Earth's magnetic field over the past few centuries have taken place
over South America and the southern Atlantic Ocean, approximately
corresponding to the South Atlantic Anomaly region.”[Emphasis
in bold−faced underline for clarity; not in original]
[66]
“MAGNETIC NORTH POLE IS MOVING AT AN ACCELERATED RATE,”
Magazine
of Engineering Dyna, “Official Organ of Science and
Technology of the Federation of Spansih [sic] Associations for
Industrial Engineers,” 01 April 2019, [Editor's Note: “Spansih”
in original, misspelled, and probably meant to say: “Spanish.”]
LINK:
https://www.DynaPubli.com/news−4/the−magnetic−north−pole−is−moving−at−an−accelerated−rate
Small
'Fair Use' Quote: “The movement of the earth's north
magnetic pole, the reference to which the compasses point, is well
known and controlled, at least since it was fixed by Ross in 1831.
Every five years its exact position is determined and the trajectory
model is checked, the last time being in 2015. [] The year of its
first determination was in the arctic islands off the north coast of
Canada and since then it has moved slowly and oscillatingly, but for
most of the 20th century, it has followed a path towards the north
pole at a speed of around 10 km/year. [] From 1990 onwards things
changed significantly, with a determined northern trajectory being
detected, which would take it to the coasts of Siberia and a
considerable increase in its speed up to 50 or 60 km/year at
present.” [Emphasis in bold−faced underline for
clarity; not in original]
[67]
“Magnetic north is shifting fast. What’ll happen to the
northern lights?: As magnetic north shifts increasingly away from the
geologic north pole – towards Siberia – studies suggest
the northern lights could move with it.,” Posted by EarthSky
Voices in EARTH, May 22, 2019,
LINK:
https://EarthSky.org/earth/magnetic−north−pole−shift−northern−lights
Small
'Fair Use' Quote: “Our planetary magnetic field has many
advantages. For over 2,000 years, travellers have been able to use it
to navigate across the globe. Some animals even seem to be able to
find their way thanks to the magnetic field. But, more importantly
than that, our geomagnetic field helps protect all life on Earth.”
[68]
“Scientists Are Zapping Fake Electrical Grids to Help Us
Survive an EMP Attack,” by Jennifer Walter, Discover
Magazine, 08 August 2019,
LINK:
http://blogs.DiscoverMagazine.com/crux/2019/08/08/emp−electromagnetic−pulse−attack−electrical−grid−solar−flare
Small
'Fair Use' Quote: “Surprise! Your Power is Out [] It
wasn’t a coincidence that 36 strings of streetlights suddenly
went dead in Honolulu on July 9, 1962. That same day, the United
States tested Starfish Prime, a nuclear bomb detonated above the
Pacific Ocean that sent out high−altitude electromagnetic
pulses – or HEMPs, as they’re known – and
accidentally took Honolulu’s power out with it. [] The bomb
test was part of Operation Fishbowl, the United States’ Cold
War−era program to develop high−altitude nuclear weapons
that could detonate above the atmosphere and emit high radiation to
compromise electronics on the ground. And even though the test site
was about 900 miles from Honolulu, the blast was strong enough to be
seen from the island and take out a transmission station.”
(Bold face in original; not edited except by use of brackets to
indicate paragraph breaks)
[69]
“Trump Acts on Critical Infrastructure Resiliency Against EMP
Threats,”
by Sonal
Patel, POWER, 26 March 2019,
LINK:
https://www.PowerMag.com/trump−acts−on−critical−infrastructure−resiliency−against−emp−threats
Small
'Fair Use' Quote: “President Trump has signed an executive
order (EO) to boost coordination for and national resilience against
electromagnetic pulse (EMP) threats—both from nuclear warfare
and natural events like solar superstorms. The action suggests new
federal mandates to protect critical infrastructure against EMP
events and attacks may be on the horizon...Industry and academia have
warned for years—and the DHS has internally recognized that—EMP
events, and especially high−altitude EMP (HEMP) events
resulting from detonation of a nuclear device, could severely damage
critical electrical infrastructure...If the E3 pulse is high enough
and long enough, it can result in grid collapse and potentially
damage transformers, experts warn. [] Solar weather events of
sufficient intensity can cause E3−type electromagnetic impacts.
In 1989, for example, a geomagnetic disturbance (GMD) caused a
regional grid collapse within 92 seconds in the Hydro−Quebec
power system that left six million customers without power for up to
nine hours. The threat of GMDs has been played up with good reason:
Space weather researchers currently estimate a 6% to 12% chance that
a Carrington−class storm—a solar storm comparable in size
to the largest on record—is likely to hit the earth within the
next 10 years.”
[70]
“Powerful solar storm narrowly missed Earth in 2012,” by
Scott Sutherland, Meteorologist/Science Writer, The Weather
Network, 02 May 2014, LINK:
https://www.TheWeatherNetwork.com/news/articles/powerful−solar−storm−narrowly−missed−earth−in−2012/26473
Small
“Fair Use” Quote: “The
current 'K−index' used to rate solar flares wasn't in use then,
but studies have estimated the strength of the Carrington super flare
at somewhere around X40 or higher, which is well off the maximum
practical end of the scale (which only goes up to X9.9). [] However,
as it turns out, it doesn't take one of these scale−shattering
solar flares to produce this kind of powerful CME, and this means
that we could be at a higher risk from solar flares than we
previously thought...Given that this CME missed us by roughly 9 days,
the use of the word 'narrowly' when describing how close it came to
us may seem a bit excessive. However, when you look at those 9 days
compared to the length of our year (the time it takes Earth to travel
once around the Sun), the distance between us and the CME was only
about 3 per cent of our orbital path. That's a pretty
narrow miss.”
COMMENT:
Actually, 9 days divided by 365¼ days is only 2.46%,
rounded to 3 significant figures.
[71]
“Time to be afraid − preparing for the next big solar
storm: Kemp,” by John Kemp, REUTERS, 25 July
2014, LINK:
https://www.Reuters.com/article/us−electricity−solarstorms−kemp/time−to−be−afraid−preparing−for−the−next−big−solar−storm−kemp−idUSKBN0FU20Q20140725
Small
'Fair Use' Quote: “What frightened the solar scientists was
that the July 2012 storm would have had a Dst index of up to −1,200
nT if it had struck Earth, making it much worse than the Carrington
Event.”
[72]
“Variations in the geomagnetic dipole moment over the last 12
000 years,” by S. Yang, H. Odah, J. Shaw, Geophysical
Journal International, Volume 140, Issue 1, January 2000,
Pages 158–162,
01
January 2000, DOI: 10.1046/j.1365−246x.2000.00011.x,
LINK:
https://doi.org/10.1046/j.1365−246x.2000.00011.x
LINK:
https://Academic.oup.com/gji/article/140/1/158/707986
Small
'Fair Use' Quote: “To a first approximation, the magnetic
field of the Earth is dipolar. The magnetic moment and orientation of
the dipole are known to have changed with time from palaeomagnetic
and archaeomagnetic measurements. An analysis of archaeointensity
results (McElhinny & Senanayake 1982) has shown that the
Earth’s dipole moment was twice the present−day
value 2000 years ago, whilst between 5000 and 6000
years ago it was much weaker. Over the past 15 years, many new
archaeointensity results have been published.” [Emphasis added
in underline and bold for clarity; not in original]
[73]
“The earth’s magnetic field: evidence that the earth is
young,” by Jonathan Sarfati, Creation Ministries
International, March 1998; updated August 2014,
LINK:
https://Creation.com/the−earths−magnetic−field−evidence−that−the−earth−is−young
Small
'Fair Use' Quote: “...archaeological measurements show that
the field was 40% stronger in AD 1000 than today,”
[Emphasis added in underline bold for clarity; not in original],
citing R.T. Merrill and M.W. McElhinney [sic: Misspelled. Is actually
spelled: “McElhinny,” without the trailing 'e'], The
Earth’s Magnetic Field, Academic Press, London, pp. 101–106,
1983, one later edition of this book which is
linked at:
https://www.Amazon.com/Magnetic−Field−Earth−Paleomagnetism−International/dp/B01F82CVW4
and
cited as: “The Magnetic Field of the Earth: Paleomagnetism, the
Core, and the Deep Mantle (International Geophysics Series),”
by Ronald T. Merrill (1996−09−03)
Hardcover (ASIN: B01F82CVW4)
by
Ronald T. Merrill; Michael W. McElhinny; Phillip L. McFadden
(Author),
and
another edition [Publisher: Academic Press; 1st edition (August
14, 1998)]
linked here:
LINK:
https://www.Amazon.com/Magnetic−Field−Earth−Paleomagnetism−International/dp/012491246X
and
cited as: “The Magnetic Field of the Earth, Volume 63:
Paleomagnetism, the Core, and the Deep Mantle (International
Geophysics),” 1st Edition (ISBN−13: 978−0124912465;
ISBN−10: 012491246X),
by
Ronald T. Merrill (Author), Michael W. McElhinny (Editor), Phillip L.
McFadden (Editor)
[74]
“The Erosion of Continents as a Creationist Clock,” by
Kevin Mellem, Department
of Earth Sciences, University of South Dakota,
Honors Seminar (UHON 390), Fall 2005,
LINK:
http://apps.usd.edu/esci/creation/age/content/creationist_clocks/magnetic_field.html
Small
'Fair Use' Quote:
“[Dr. Thomas] Barnes used the data of McDonald and Gunst to
plot an exponential curve and, by extrapolating the observed data
backward into time using his exponential decay equation, Barnes
claimed that the
magnetic field was
approximately 40 percent stronger in 1000 A.D.
than it is today
(Sarfati 1998).” [Comments added in basket to clarify Dr.
Barnes's first and last name; Emphasis added in underline and bold
for clarity; not in original]
[75]
Image 1., Photo of Earth's sun, titled: “He II (304 Å)”
; Taken at 19:19 UT, 28 February 2000,as
depicted in the NSSDCA
Photo Gallery
(the “NASA Space Science Data Coordinated Archive,”
NASA's archive for space science mission data), and released into the
public domain. Original image reduced to
30%
resolution
to squeeze it into this paper—and used for illustration
purposes only. Author/curator: Dr. Edwin V. Bell, II ; NSSDCA, Mail
Code 690.1, NASA Goddard Space Flight Center, Greenbelt, MD 20771,
PHONE: +1−301−286−1187, Email: Ed.Bell@nasa.gov,
NASA Official: Dr. David R. Williams , Version 2.5, 10 December 2012,
Source URL for image:
https://NSSDC.gsfc.nasa.gov/image/solar/eit_sl_304.jpg
Article
URL for image:
https://nssdc.gsfc.NASA.gov/photo_gallery/photogallery−solar.html
Copyright
statement from NASA:
“NSSDCA Photo Gallery: Frequently Asked Questions (FAQ) [] Can
I use the images from NSSDCA's Photo Gallery or do I need to obtain
permission from somebody first?
[] Unless otherwise noted, the images presented on NSSDCA's Photo
Gallery are in the public domain. As such, they may be used for any
purpose. NSSDCA does ask, however, that you acknowledge NASA and the
NSSDCA as the supplier of the data. In addition, where the source of
the image (by project or as a specific person) is credited in the
text, you should also acknowledge that, too. [] In addition, NASA
further requires that NASA images cannot be used to imply endorsement
by NASA.”
LINK:
https://NSSDC.gsfc.nasa.gov/photo_gallery/photogallery−faq.html#use
[76]
Image 2., The sun hits earth's protective magnetic field with a CME
(coronal mass ejection), and/or a solar flare; artist's rendition,
from “The Impact of Flares,” NASA,
NASA Official: Gordon Holman; Web Curator: Kim Tolbert; no known
copyright, and assumed to be released into the public domain, as
shown for other official governmental work, and cited in reference
[75], above. If there is a copyright, then this author claims “Fair
Use” for academic research, criticism, and commentary of
copyrighted works. Image used for illustration purposes only, in this
paper. Unaltered original image—and used for illustration
purposes only.
Image
LINK:
https://hesperia.gsfc.NASA.gov/rhessi3/pics/NASAsunEarthConnection.jpg
Article
LINK:
https://hesperia.gsfc.NASA.gov/rhessi3/mission/science/the−impact−of−flares/index.html
[77]
Image 3., GRAPH: The Maunder Minimum, a time in history, from
1645—1715, when sunspots were
very
rare, and where solar events (CME's, solar flares, solar storms,
etc.) were at a low ebb, from “SDO Science,” NASA,
NASA Official: Dean Pesnell; Webmaster: Kevin Addison; no known
copyright, and assumed to be released into the public domain, as
shown for other official governmental work, and cited in reference
[75], above. If there is a copyright, then this author claims “Fair
Use” for academic research, criticism, and commentary of
copyrighted works. Image used for illustration purposes only, in this
paper. Original image reduced to
65%
resolution
to squeeze it into this paper—and used for illustration
purposes only.
Image
LINK:
https://sdo.gsfc.NASA.gov/assets/img/site/sunspot_web.png
Article
LINK:
https://sdo.gsfc.NASA.gov/mission/science.php
[78]
Image 4., Earth's protective geomagnetic field during normal
activity, between pole flips / reversals (depicted on the left), and
during geomagnetic reversals (depicted on the right).from “Reversing
the Geomagnetic Field,” by Aaron Gronstal (SOURCE:
International
Journal of Astrobiology),
published by NASA,
NASA Official: Mary A. Voytek; Last Updated: September 26, 2019; no
known copyright, and assumed to be released into the public domain,
as shown for other official governmental work, and cited in reference
[75], above. If there is a copyright, then this author claims “Fair
Use” for academic research, criticism, and commentary of
copyrighted works. Image used for illustration purposes only, in this
paper. Unaltered original image—and used for illustration
purposes only; IMAGE CREDIT: NASA.
Image
LINK:
https://astrobiology.NASA.gov/uploads/filer_public_thumbnails/filer_public/50/29/50294d28−1475−4a84−a6e2−b9238fbb33cb/54559main_comparison1_strip.gif__1240x510_q85_subject_location−109%2C115_subsampling−2.jpg
Article
LINK:
https://astrobiology.NASA.gov/news/reversing−the−geomagnetic−field
Source
LINK:
https://www.Cambridge.org/core/journals/international−journal−of−astrobiology/article/div−classtitledoes−the−planetary−dynamo−go−cycling−on−re−examining−the−evidence−for−cycles−in−magnetic−reversal−ratediv/D76239E251882C4BCADFDEC81B0BBC40
[79]
Image 5., from “The Aurora!,” NASA, A
NASA/IMAGE Resource in space science education; an image of the
Aurora Borealis, the Northern Lights, and published
by NASA,
at the links below; no known copyright, and assumed to be released
into the public domain, as shown for other official governmental
work, and cited in reference [75], above. If there is a copyright,
then this author claims “Fair Use” for academic research,
criticism, and commentary of copyrighted works. Image used for
illustration purposes only, in this paper. Unaltered original
image—and used for illustration purposes only; IMAGE CREDIT:
Jan Curtis, 2571 NW 3rd Terrace, Gresham, OR 97030, Email:
JanCurtis.nl@gmail.com
Image
LINK: https://image.gsfc.NASA.gov/poetry/educator/curtis1.jpg
Article
Link:
https://image.gsfc.NASA.gov/poetry/educator/Aurora79.html
Author
Page LINK:
http://climate.gi.Alaska.edu/Curtis/curtis.html
[80]
Image 6., from “The Aurora!,” NASA, A
NASA/IMAGE Resource in space science education; an image of the
Aurora Borealis, the Northern Lights, and published
by NASA,
at the links below; no known copyright, and assumed to be released
into the public domain, as shown for other official governmental
work, and cited in reference [75], above. If there is a copyright,
then this author claims “Fair Use” for academic research,
criticism, and commentary of copyrighted works. Image used for
illustration purposes only, in this paper. Unaltered original
image—and used for illustration purposes only; IMAGE CREDIT:
Dick Hutchinson; Image
LINK:
https://image.gsfc.NASA.gov/poetry/educator/hutch3.jpg
Article
Link:
https://image.gsfc.NASA.gov/poetry/educator/Aurora79.html
[81]
Image 7., Photograph of Earth: View of the Eastern Pacific Ocean
(just off the coast of South America) from Galileo,
as depicted in the NSSDCA
Photo Gallery
(the “NASA Space Science Data Coordinated Archive,”
NASA's archive for space science mission data), and released into the
public domain. Original image reduced to
30%
resolution
to squeeze it into this paper—and used for illustration
purposes only. Author/curator: Dr. Edwin V. Bell, II ; NSSDCA, Mail
Code 690.1, NASA Goddard Space Flight Center, Greenbelt, MD 20771,
PHONE: +1−301−286−1187, Email: Ed.Bell@nasa.gov,
NASA/GSFC Security and Privacy Statement, NASA Official: Dr. David R.
Williams, Version 3.5, 09 September 2003
Source
URL for image:
https://nssdc.gsfc.NASA.gov/image/planetary/earth/gal_east−pacific.jpg
Article
URL for image:
https://nssdc.gsfc.NASA.gov/photo_gallery/photogallery−earth.html
Copyright
statement from NASA:
“NSSDCA Photo Gallery: Frequently Asked Questions (FAQ) [] Can
I use the images from NSSDCA's Photo Gallery or do I need to obtain
permission from somebody first?
[] Unless otherwise noted, the images presented on NSSDCA's Photo
Gallery are in the public domain. As such, they may be used for any
purpose. NSSDCA does ask, however, that you acknowledge NASA and the
NSSDCA as the supplier of the data. In addition, where the source of
the image (by project or as a specific person) is credited in the
text, you should also acknowledge that, too. [] In addition, NASA
further requires that NASA images cannot be used to imply endorsement
by NASA.”
LINK:
https://NSSDC.gsfc.nasa.gov/photo_gallery/photogallery−faq.html#use
[82]
Image 8., Photo of one of the Voyager spacecraft, NASA's Mariner
series,as depicted in the NSSDCA
Photo Gallery
(the “NASA Space Science Data Coordinated Archive,”
NASA's archive for space science mission data), and released into the
public domain. Original image reduced to
65%
resolution
to squeeze it into this paper—and used for illustration
purposes only. Author/Curator: Dr. Edwin V. Bell, II, Mail Code
690.1, NASA Goddard Space Flight Center, Greenbelt, MD 20771, PHONE:
+1−301−286−1187, Email:
Ed.Bell@NASA.gov,
NASA Official: Dr. David R. Williams, Version 2.5, Last Updated: 26
November 2018, Source URL for image:
https://nssdc.gsfc.NASA.gov/image/spacecraft/voyager.jpg
Article
URL for image: https://nssdc.gsfc.NASA.gov/planetary/voyager.html
Copyright
statement from NASA:
“NSSDCA Photo Gallery: Frequently Asked Questions (FAQ) [] Can
I use the images from NSSDCA's Photo Gallery or do I need to obtain
permission from somebody first?
[] Unless otherwise noted, the images presented on NSSDCA's Photo
Gallery are in the public domain. As such, they may be used for any
purpose. NSSDCA does ask, however, that you acknowledge NASA and the
NSSDCA as the supplier of the data. In addition, where the source of
the image (by project or as a specific person) is credited in the
text, you should also acknowledge that, too. [] In addition, NASA
further requires that NASA images cannot be used to imply endorsement
by NASA.”
LINK:
https://NSSDC.gsfc.nasa.gov/photo_gallery/photogallery−faq.html#use
[83]
Image 9., a “Linear Regression” graph created by this
researcher (Gordon Wayne Watts), using Graph, Version 4.3, Build 384
(Copyright Ivan Johansen, 2007, Email: Graph@Padowan.dk
; Website: http://www.Padowan.dk),
with trendlines representing both an Exponential trendline and
selected orders of power of Polynomial trendlines. DATA used for this
graph are the five (5) data points taken from Table 4. of this paper,
and using “49%” for the 5th and last
data point, where a choice is given. This graph is shown twice
in this paper: Once as an “8½−x−11”
portrait−view compliant image, embedded within this paper, and
with “cutoff” artifacts of the image manually corrected,
and with the formula legend arbitrarily enlarged for viewing
convenience; and, again, as and “11−x−8½”
landscape−view compliant image, as a separate PDF file,
attached to the bottom of this paper, and manually appended using
“PDF Split and Merge basic,” Version 2.2.4., Console
version: 2.4.3e Developed by: Andrea Vacondio Build date: 25−Jun−2014
Java home: C:\Program Files\Java\jre6 Java version: Java(TM) SE
Runtime Environment 1.6.0_16−b01 Max memory: 254Mb
Configuration file: C:\Program Files\PDF Split And Merge
Basic\pdfsam−config.xml Website: http://www.PdfSam.org
[84]
Image 10., a “Linear Regression” graph created by this
researcher (Gordon Wayne Watts), using Graph, Version 4.3, Build 384
(Copyright Ivan Johansen, 2007, Email: Graph@Padowan.dk
; Website: http://www.Padowan.dk),
with trendlines representing both an Exponential trendline and
selected orders of power of Polynomial trendlines. DATA used for this
graph are the five (5) data points s taken from Table 4. of this
paper, and using “5%” for the 5th and
last data point, where a choice is given. This graph is shown twice
in this paper: Once as an “8½−x−11”
portrait−view compliant image, embedded within this paper, and
with “cutoff” artifacts of the image manually corrected,
and with the formula legend arbitrarily enlarged for viewing
convenience; and, again, as and “11−x−8½”
landscape−view compliant image, as a separate PDF file,
attached to the bottom of this paper, and manually appended using
“PDF Split and Merge basic,” Version 2.2.4., Console
version: 2.4.3e Developed by: Andrea Vacondio Build date: 25−Jun−2014
Java home: C:\Program Files\Java\jre6 Java version: Java(TM) SE
Runtime Environment 1.6.0_16−b01 Max memory: 254Mb
Configuration file: C:\Program Files\PDF Split And Merge
Basic\pdfsam−config.xml Website: http://www.PdfSam.org
|
I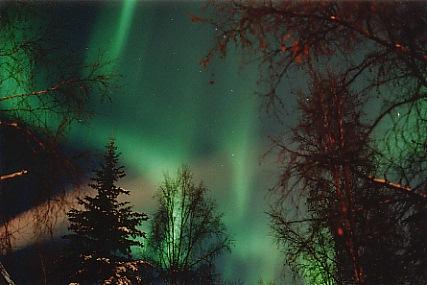
mage
5. Aurora Borealis, seen through the trees: The
Northern Lights[79]
|
|
Table
2.
5.
Below is a copy & paste of selected data I used from prior
research, and is identified as such by citation: [PART
I.
Threats/dangers posed...(continued)]
|
|
TABLE VI from
Cliver, cited above in [36]: The 25 largest geomagnetic storms
based on the Dst index, from 1932–2002 [Based on Dst index
from Karinen and Mursula, 2004], copied/pasted below:
Date Time (UT
h) Peak value (nT)
14
Mar. 1989 01 −548
05
Jul. 1941 13 −453
28
Mar. 1946 14 −440
15
Jul. 1959 19 −434
11
Feb. 1958 11 −428
13
Sep. 1957 10 −426
26
May 1967 04 −391
31
Mar. 2001 08 −383
01
Mar. 1941 18 −382
09
Nov. 1991 01 −375
24
Mar. 1940 20 −366
19
Sep. 1941 06 −359
25
Jan. 1938 23 −352
26
Jan. 1949 00 −350
22
Jan. 1938 11 −344
08
Jul. 1958 20 −334
13
Nov. 1960 09 −333
30
Apr. 1960 18 −325
01
Apr. 1960 18 −325
05
Sep. 1957 03 −324
14
Jul. 1982 03 −322
04
Sep. 1958 22 −305
23
Sep. 1957 07 −302
16
Jul. 2000 00 −301
25
Mar. 1991 00 −297
|
|
From:
“Table 5: Top 10 Dst Storms*” [from NOAA “Halloween”
paper] – June 2004 paper. [28]
Rank Dst (nT)
Date
1
−589 03/14/1989
2.
−465** 11/20/2003
3.
−429 07/15/1959
4.
−427 09/13/1957
5.
−426 02/11/1958
6.
−401** 10/30/2003
7.
−387 03/31/2001
8.
−387 05/26/1967
9.
−354 11/09/1991
10.
−339 11/13/1960
*Dst
data from Kyoto World Data
Center−C2
in Kyoto, Japan.
**Provisional
Dst – not the final value
|
|
From
Geophysical Research Letters
[38]
“Table
1. Geomagnetic and Interplanetary Parameters of Superstorms of
Solar Cycle 23
Time/Date
Dstp, nT
01:00
04/07/2000 −287
01:00
07/16/2000 −301
09:00
03/31/2001 −387
00:00
04/12/2001 −271
07:00
11/06/2001 −292
01:00
10/30/2003 −353
23:00
10/30/2003 −383
21:00
11/20/2003 −422
07:00
11/08/2004 −373
10:00
11/10/2004 −289
09:00
05/15/2005 −263
3.
Results...”
|
I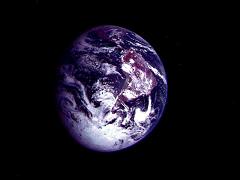
mage
7.
Photograph of Earth: View of the Eastern Pacific
Ocean (just off the coast of South
America) from Galileo[81]
6.
Discussion:
[PART II: My key findings – discussion]
In
this section, I will attempt to assess the probabilities of
estimation of a catastrophic event. Initially, it is appropriate to
see where prior research has taken us here. First off, Riley[49][50]
estimated the probability of another Carrington−class storm to
be “occurring within the next decade is ~12%,” using the
Power Law, and went on to explain it thus: “A
final tool that will be useful for our analysis relies on the average
time to the next event to compute a probability of occurrence. For
Bernoulli distributions, that is, independent events that either
happen or do not, with a constant probability of occurrence, it can
be shown that the probability of occurrence is given by
P(x)
= [1/(1+τ)],
where
τ
is the average time to
the event. Thus, an event that occurs once every 100 years would have
a probability, P = 1/(1 + 100/10) = 0.09, or 9% of occurring during
the next decade.”[50] Looking at his formula, and comparing it
with his example (in the text of his paper), it is clear that Riley
didn't quite state the formula correctly: He accidentally used a
denominator of (1+τ),
that is, (1+A),
e.g., “one plus the average time to event,” and not
accounting for the time−span under consideration—a decade
here. But, ignoring Riley's typo, and correcting his formula, rather,
it should be stated as follows:
P(x)
= [1/(1+ A/t)],
where:
P(x) = Probability of the event;
A = Average time to event; and,
t = time−span under consideration for probability
of occurrence.
Analysis
of the Riley exponential formula
That said, it's also clear that his formula is
exponential in nature, and (more−importantly) it seems “sound”
on both the extremes and the “center” of the curve—let's
use 100−years as the “average” time between
Carrington Event's in this example:
(1)
Set “t = 1 year,” and we get P(x) = [1/(1 + A/t)] = [1/(1
+ 100/1)] = 1/101 = 0.099= 0.99%
(to 3 significant
figures, when considering the final percent value), which seems
reasonable, because the odds of a once−in−a−lifetime
event are quite low for just the next year.
(2)
Set “t = 1,000 years,” and we get P(x) = [1/(1 + A/t)] =
[1/(1+ 100/1,000)] = 1/(1 + 0.1) = 0.909= 90.9%
(to 3 significant
figures, when considering the final percent value), which seems
reasonable, because the odds of any event are quite high when looking
at a very long time−frame.
(3)
Set “t = 100 year,” and we get P(x) = [1/(1 + A/t)] =
[1/(1 + 100/100)] = 1/(1 + 1) = 0.5 = 50.0%
(to 3 significant
figures, when considering the final percent value), which seems
reasonable, because the odds of a once−in−a−lifetime
event are probably about 50% when considering the entire “life−time”
of, say, a person who lives to be a hundred years old. If we assume
that Riley obtained 12% for his final figure for the next decade,
then we can solve for the time−frame he assumed, using P(x) =
[1/(1 + A/t)]
0.12 = [1 / (A / 10)] – rearranging this, we get:
0.12 * (A / 10) = 1.00 – rearranging this, we get:
0.12*A / 10 = 1.00 – multiplying out, we get:
0.012*A = 1.00 – and, solving for A, we get:
A = 1.00 / 0.012 (in years, of course) = 83.33 years.
Not sure how he derived 83.3 years, but considering that Riley's
paper was written in 2012, and the Carrington Event was in 1859, we
have a time−lapse of 153 years, and two such “Carrington−class”
events, both the namesake event in 1859, and then the “Solar
Super Storm of 2012,” which prompted all the attention from
scientists. Assuming he estimated 2 such events every 153 years, this
would mean an “average” time of 76.5 years between
events, close to my 83.33 derivation.
Using
76.5 as my baseline average, P(x) = [1/(1 + A/t)] = [1/(1 +
76.5/10.0)] = [1 / (1 + 7.65)] = 11.561%
to five significant figures, almost the 12% figure stated in the
paper, and a 1−in−8.65 chance (close to the news
article's interpretation in WIRED
magazine.[49] In fact, Riley also had stated: “Additionally,
since the event occurred only ~150 years ago, it is a constant
reminder that a similar event could reoccur any day.”[50] Using
150−years as my average time between events, with an average
time of once every 75−years, we get a P(x) = [ 1 / (1 + 75/10)
] = 11.76%
chance. That seems right because the “average time to event”
is half of either extreme: “Zero−time” and the
average time to “next” event, since, on average, you
would be in “the middle” of such a time−line.
However,
Moriña[40], using a “counting process with Weibull
inter−occurrence times in order to estimate the probability of
extreme geomagnetic events,” came up with a much lower figure
in a more−recent paper, which finds that: “the
probability of occurrence on the next decade of an extreme event of a
magnitude comparable or larger than the well−known Carrington
event of 1859 is explored, and estimated to be between 0.46%
and 1.88% (with a 95% confidence),
a much lower value than those reported in the existing
literature.”(Bold face for clarity; not in original)[40] What
are Weibull−based statistical analyses, you might ask? Moriña
helps us by explaining that: “the scale parameter of the
inter−occurrence time [in other words, the time between
geomagnetic storms of a given intensity] distribution grows
exponentially with the absolute value of the intensity threshold
defining the storm, whereas the shape parameter keeps rather
constant.”(My comments in brackets to clarify; not in
original)[40] In other words, he is saying that a storm twice as
powerful does not necessarily have “half” the chance of
occurrence, but rather, less, because there's an exponential element
to the probabilities. Thus, the data on smaller, more−recent,
geomagnetic storms might lead researchers to underestimate the
average time to a given storm of a larger magnitude, or, put another
way, to overestimate the probabilities of occurrence.
So,
Riley estimates about 12%
probability[50], and Moriña estimates[40] about 1.17%
(taking the average of “0.46% and 1.88%,” from his
research paper). These results are very much in disagreement, opening
the door to confusion, prompting this researcher to “look
further.”
While statistics is an interesting avenue to pursue in
analyzing data, this paper will not follow Moriña's path, but,
rather, do something much more concrete: We will look at actual
storms in recent decades, and make assumptions based on a direct
time−averaging method so see “how often” storms of
a given magnitude occur, that is, the average time between
geomagnetic storms of known magnitude and danger levels. To obtain a
“baseline” for 'which' storms to count, we look mainly as
the published news media of damage associated with a given storm, but
also make inferences based on the Dst values of the storms. With that
model, here are my findings:
My data lists forty−six (46) verified storms from
1859 to 2012. (There may have been more that were overlooked due to
the human limitations of this researcher, so this is a “low”
estimate.) In every single entry, above, there was either wide−spread
damage and interference, or at least the inference that it was
possible, when looking at the Dst readings of storms which garnered
lesser levels of press coverage. While not all of the storms were
grave threats, nonetheless, all 46 of the geomagnetic storms I list
in my research are documented to have the potential for wide−spread
damage to the power grid, telecommunications, and such.
This
researcher can't find any more recent severe geomagnetic events, in
published news media reports, since the 2012 super storm, and will
infer that we are at a low level of geomagnetic disturbance at this
time. As such, the “time span” in question will use from
late 1859 to late 2019 as the base time period, i.e., 160 years. With
160 years and 46 dangerous storms, we can safely infer that the
“average time” between is a little bit less
than 3 and−a−half years.
(160 years / 46 events = 3.478
years/event, to 4 significant
figures.)
While my standards for what constitutes a “dangerous”
storm are slightly lower than the extreme case, it is clear from
looking at the published news reports of each of the 46 events that
each one either did, or could very easily, cause significant damage
to the electrical and communications grid.
In
this manner, the extreme geomagnetic events are not unlike solar
eclipses,
category−5
hurricanes,
volcanoes,
and large−magnitude
earthquakes:
They are happening all the time around the world – example: A
solar eclipse over the ocean, where there are no observers, or an
earthquake in an uninhabited region, a “submarine volcano”
(underwater), which is not always in plain sight, or a “fish
storm,” a hurricane or tropical storm, with a trajectory
towards the open Atlantic, which poses no threat to land.
But,
unlike the hurricanes (which pose the same threat in the technology
era, as they have in past centuries), the geomagnetic storms in
modern times pose a far larger threat than in decades past: We now
have very sensitive GPS, satellites, and power & communications
grids—and, by extension, a nation's economy and social
stability are impacted when (not if, but when) we get hit with “the
big one.” When past geomagnetic storms hit, we did not have
such delicate integrated circuitry, computers, and electrical &
communications infrastructure, which is particularly susceptible to
damage. But, as many recent geomagnetic events have shown us, the
threat is real, interfering with aircraft communications[20], several
times tempting us to go to war with the Soviet Union[20][51]
(or other nations), when, in fact, they were not the ones disrupting
communications, even setting off underwater sea−mines.[18] I
estimated above an average of only 3.478 years between severe
geomagnetic storms, which implies a very high probability of such a
storm in the next decade:
P(x)
= [1/(1+ A/t)] = [ 1 / (1 + 3.478/10) ] = 0.7419 = about
a 75%
chance
of such an event within the next decade.
But recalling that only some of the geomagnetic events in my table
are documented to have actually done damage, it would only be fair to
recalculate this probability:
DATA, from Table
1., above: Number of storms with documented damage to the grid: 14
(List of storms from
my table: 1,2,3,4,6,10,24,25,28,29,30,35,40,41) – From 1859 to
2019 is 160 years, and that means that there's an average of about
11.43 years between storms. Re−calculating yields this result:
P(x)
= [1/(1+ A/t)] = [ 1 / (1 + 11.43/10) ] = 0.4667 = about
a 47%
chance
of such an event with the next decade.
That estimate is much
higher than either of the previously reported estimates, but each of
these events (except the “Near Miss of 2012”) were
smaller, less−destructive Solar Geomagnetic storms than the
“Carrington Event,” itself –and are, as such,
expected to happen more often.
But
I stand by my estimate because each – and every one – of
the fourteen (14) named storms on my table, above, are documented to
have caused widespread damage to the grid (or, in few cases,
threatened the lives of our astronauts—and caused them major
discomfort in the interim). Moreover, even those events listed on my
table which don't have any record of having caused damage are in
most, or all, are
documented to have been very powerful by several metrics:
Dst (Disturbance−storm time) measurements, GLE (ground level
enhancement) measurements, size & strength of CME's (coronal mass
ejections), and brilliance of polar
lights, as well as how
far south the “Northern lights” are said to have been
seen, as well as size, strength, and/or quantity of solar flares,
even for solar storms with “weak” Dst readings.
So,
while my calculated probability is for a storm of “less than”
the original Carrington Event, nonetheless, each of the 14 examples
on my table are
documented to have done actual and tangible damage,
even if not on a “planet−wide” scale in every case.
Thus, the threats posed are probably greater than previously reported
because previous researchers overlooked events that knocked out only
some (but not all) of the planet's power or communications grids.
With threatening geomagnetic events occurring, on average, every 11
or 12 years, we now turn to other factors to consider when weighing
estimation of probabilities.
The
July 2012 “Superstorm,” narrowly missed earth by only
about nine (9) days [about 2.46%
of earth's 365¼−day
orbit] from its trajectory[70], with
a peak Dst value of −1,182
nT, as
reported by Space
Weather[31],
or even a peak Dst value of −1,200
nT,
as reported by REUTERS[71],
thus with such a catastrophic sized storm, a “near miss”
of only 2.46% of earth's orbit certainly qualifies as a near miss,
and I shall assign this a “½” value of an event:
It nearly took out the planet, from top−to−bottom.
In this last
probability calculation, I will assume that the “Near Miss of
2012” counts for a “half” of an event, and the
actual Carringtom Event counts as “1” event. Thus, I
derive an average of 1.5 Carrington−Class Events every 160
years, and come up with this final result: An event occurs—on
average—every 106.67 years:
P(x)
= [1/(1+ A/t)] = [ 1 / (1 + 106.666667/10) ] = 0.0857143 or about
8.57%
rounded to 3 significant figures.
My
findings of an 8.57%
chance of another Carrington Event are indeed between the Riley
estimates of about 12%
probability[50], and Moriña's estimates[40] about 1.17%
(taking the average of “0.46% and 1.88%,” from his
research paper). I stand by my estimate as it's methods are sound and
its results are between both extremes in the reported literature.
CAVEATS:
My
probability estimation, here, is probably low for several reasons:
First,
due to human limitations, I can not review all
the solar geomagnetic events in the peer−reviewed scientific
literature—meaning there were certainly some data points I
overlooked when calculating the probabilities of another catastrophic
event. Secondly,
the upcoming Maunder Minimum is not a certain event. (And, even
during solar 'minimums', there have been notably strong solar
geomagnetic events), so even given a 'low', there is no guarantee of
safety.) Thirdly,
we have not even accounted for the accelerating collapse (decreases
in strength) of earth's protective magnetic field—which protect
earth from severe solar geomagnetic events. Bonus
fourth factor:
While the upcoming “magnetic flip,” in
and of itself,
does not place earth in any more jeopardy or danger for severe
geomagnetic storms (other
than determining which areas of earth have the
strongest magnetic protection, based on the vectorial direction of
the magnetic field, which protects most at the equator where magnetic
flux is perpendicular
to solar rays—and
not parallel,
as is with the field at the north and south poles), the moving
magnetic north and south poles make GPS and other navigation less
accurate. And, when the field inevitably collapses (as it has many
times in earth's past history), there will be no reliable magnetic
north for reference by GPS, compasses, or other
geomagnetically−referenced navigation. Bonus
fifth factor:
Even if my estimation is low, the damage done by such a severe event
is catastrophic, and it is good to err on the safe side. Given that
both the geomagnetic field collapse and the pole “flip”
are accelerating at unprecedented rates, caution is in order, and
prediction of future field strength is anyone's guess.
Below, I will address
additional factors of importance.
7.
The
upcoming “Maunder Minimum”: [PART
II: Key findings – continued]
The
“Maunder Minimum” is a time period from 1645 to 1715 in
which sunspots became exceedingly rare.[52] Without going into
details, it is thought that we might be entering another “minimum”
solar period.[53] A quick glance at the graph posted on the Universe
Today
article[53] is clear: Solar cycles 22, 23, and 24 get progressively
smaller. In fact, Miyahara goes on to conclude that “The solar
cycle is likely to show characteristic precursory features leading up
to intervals of sunspot absence, and which can be differentiated by
events of different durations.”[54] But the research is still
not clear, and thus we can not depend on a new “Maunder
Minimum” in the near future to protect us from any severe
geomagnetic events.
|
I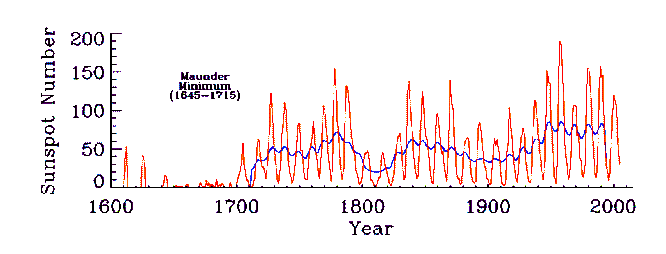
mage
3.
The Maunder Minimum, a time in history, from 1645—1715, when
sunspots were
very rare, and where solar
events (CME's, solar flares, solar storms, etc.) were at a low
ebb[77]
|
8.
The
11−year solar cycle: [PART
II: Key findings – continued]
It
is also a known quantity that sunspots (and related solar events:
solar flares, CME's – coronal mass ejections, and sever
geomagnetic storms, like the 46 storms in my main table, above)
increase during a “solar maximum,” the peak of the
approximately 11−year solar cycle. But, is this any guarantee
of protection from a severe geomagnetic storm during a minimum? The
Geomagnetic Storm of 8−9 February 1986; had a peak Dst value of
−301
nT,
as
reported by the Royal
Academy of Engineering[41];
and, it had a peak Dst value of −307
nT,
as
reported by the Research
in Astronomy and Astrophysics[42],
very powerful by any measure: “By chance this storm was the
largest recorded storm, since 1960 and the eighth largest since 1932
(Allen 1986).”[42] However, it occurred at almost the very
minimum of the 11−year solar cycle, as reported by the Research
in Astronomy and Astrophysics:
“Two
other factors made this storm particularly unusual (i) it occurred
near the minimum of the Sun’s activity cycle; and (ii) it was
apparently caused by flares that could be described as moderate to
large.”[42] This unusual occurrence
prompted the Royal
Academy of Engineering
to
caution us that: “This storm shows that extreme events can
occur at any phase of the solar cycle and it is unwise to focus
mitigation efforts only around solar maximum.” (pp.17—18){small
quote used under Fair Use}[41] So, even assuming we enter a new
“Maunder Minimum,” and then go on to enter the “bottom”
of that solar cycle, there is no guarantee of safety of the grid:
Dangerous solar flares can happen at any time.
9a.
The
collapsing
geomagnetic field
(and upcoming pole reversal)
[PART
II: Key findings – continued]
It
is a well−known fact that earth's magnetic poles are moving,
and, at the same time, the strength of our geomagnetic field has been
steadily weakening. These two phenomena are related because when
there is a “magnetic field” flip (like has happened many
times in earth's past), compasses will point to, basically, the
opposite direction. SPACE.com
reports that “Earth's north magnetic pole is so out of whack
that scientists need to update the global magnetic−field model
they released only four years ago. Could that be a sign that the
magnetic pole will flip soon?”[55] PHYS.ORG
warns us that “'This is a region where we see that satellites
consistently (experience) electronic failures,' said Prof.
Finlay,”[56] a problem we're now facing because earth's
magnetic field is what shields us from harmful cosmic rays, solar
flares, and the like: “As Earth's magnetic shield fails, so do
its satellites. First, our communications satellites in the highest
orbits go down. Next, astronauts in low−Earth orbit can no
longer phone home. And finally, cosmic rays start to bombard every
human on Earth.”[56] In fact, NASA
reports that “Earth has a magnetic field. It shields us from
the full effects of the solar wind and GCR,” referring to
galactic cosmic rays.[57] This trend is relevant, not only because
earth's magnetic field protects sensitive electronic equipment, but
also because is protects us, humans: “Beyond Low Earth Orbit,
space radiation may place astronauts at significant risk for
radiation sickness, and increased lifetime risk for cancer, central
nervous system effects, and degenerative diseases.”[57]
|
I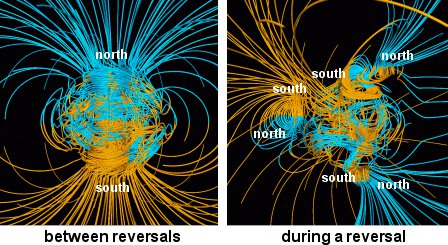
mage
4.
Earth's protective geomagnetic field during normal activity,
between pole flips /
reversals (depicted on the
left), and during geomagnetic reversals (depicted on the
right)[78]
|
So,
without going into any graphic analysis, it suffices to say that any
threats posed by solar flares and catastrophic geomagnetic solar
storms will, increasingly, pose more of a threat as Earth's magnetic
field continues to weaken. Worse yet, the December 2018 paper by
PHYS.org
goes on to
report[56] that: “Scientists
first noticed the SAA [the “South Atlantic Anomaly”] in
the 1950s, and since then it has decreased in strength by a further
6%, as well as moving closer to the west.'”(Comments in bracket
to define “SAA”; not in original) The problem here?
While
this 6% decrease only refers to the South Atlantic Anomaly region, if
the velocity of decrease holds true for the entire geomagnetic field,
then 2018 (the date of the article) minus 1955 (the midpoint of the
1950's) implies a 63−year period is needed for every 6%
decrease, that is, a reduction to 0.94 for each period. The next
63−year period would, then, be expected to be only 88.36% of
the strength in 1955. Moreover, if our previous loss of 30% took
3,000 years[56], then we are accelerating our descent: Notice that it
only takes six periods of 63 years to get the same loss at this rate:
(0.94)^6 = 0.689869781056, or 69% (to 2 significant figures), a loss
of 31% in only six 63−year periods, or 378 years, much
faster
than our previous 30% loss—which
took 3,000 years.[56]
Does
the SAA trend suggest what happens planet−wide? SCIENTIFIC
AMERICAN
gives us a clue: “At most places there has been a general
decrease in the strength over the past century, typically ten percent
or so.”[58] Is this similar to the velocity of decrease
reported by PHYS.org data,
above? ANSWER: Using logarithms (math not shown here, but figures in
this paragraph to 7 significant figures), it is seen that we need
only 5.764406 “periods” of 63 years (per PHYS.org)
or 3.385281 “periods” of a century (per SCIENTIFIC
AMERICAN)
to get a 30% loss. Let's check our math, first, to be sure:
(0.94)^
5.764406 = 0.70 or about 70%. [So, 5.764406 periods of 63 years each
is 363.157578 years.],
SAA
(0.90)^
3.385281 = 0.70 or about 70%. [So, 3.385281 periods of 100 years is
338.5281 years.], planet−wide
In
fact, the SAA estimate I made from PHYS.org
was not even as fast as the “planet−wide” estimate
from SCIENTIFIC AMERICAN,
achieving the same 30% loss (e.g., down to 70% field strength) in
about 338.5 years, even faster than the approximately 363−year
estimate merely looking at the South Atlantic Anomaly region.
NATIONAL GEOGRAPHIC
also reports that earth's magnetic “pole now is moving faster
than it has for decades.”[59] This is significant for 2
reasons: First, the rapid movement of the magnetic field also disrupt
communications and navigation: “The changes have been so large
that scientists began working on an emergency update for the World
Magnetic Model, the mathematical system that lays the foundations for
navigation, from cell phones and ships to commercial airlines,”[59]
but more−importantly, as we've seen, the rapid movement of the
magnetic north and south poles is associated with the collapsing
(decreasing) protective geomagnetic field: When there's a “pole
flip,” both phenomena occur together. But, just how fast is
this pole−flip and field collapse accelerating? In a report
this year, 21stCenturyWire.com
reports that
“The north magnetic pole sped across the International Date
Line last year at a rate of 55 km per year, more than three times as
fast as it moved before the mid−1990s. Now located in the
Eastern Hemisphere, it’s moving away from Canada and
approaching Siberia.”[60]
It is known that earth's circumference is about 24,901
miles, or about 40,075 km, meaning the distance between north and
south poles is about 20,037.5 km.
Why is that significant? At a rate of 55 km/year, the
poles would need only about 364.3 years to “flip,” that
is, have the geomagnetic north pole go to the opposite end of earth.
Let's do the math, just to be sure:
[20,037.5 km/year] divided by [55 km] = about 364.3
years to 4 significant figures.
The
55 km/year figure quoted by 21stCentrutyWire.com
seems accurate:
An article, just this year, from LiveScience
gives the same
figure: “News of the magnetic north's meanderings isn't exactly
new. Researchers figured out in the 1800s that magnetic north tended
to drift. Then, in the mid−1990s, it began moving faster, from
just over 9 miles (15 kilometers) a year to about 34 miles (55 km)
annually, Nature reported. In 2018, magnetic north skipped over the
International Date Line and entered the Eastern Hemisphere.”[61]
In fact, the American Geophysical
Union
reported, in a 2016 paper, a rate as high as 60 km per year[65], an
this 60 km/year figure is backed up by an April 2019 paper by
Magazine of Engineering Dyna[66]
and a paper as recent as mid−May 2019 published by the EUROPEAN
SPACE AGENCY[64].
Using this newer updated data finds this result:
[20,037.5
km/year] divided by [60 km] = about 333.9583
years
to 7 significant figures, which is even less than the 338.5281−year
calculation, above.
The velocity accelerated to almost four (4) times its
prior rate. Moreover, as stated above, the last 30% drop took 3,000
years, and this time, it looks to need only about 338.5 or 363.2
years (or even just 333.9583 years). So, both phenomena are quickly
accelerating. If we encounter a pole−flip, the velocity of the
magnetic pole movement may accelerate even faster, and earth's
protective geomagnetic field may start to collapse at an even faster
rate, and it may drop to close to zero, leaving us vulnerable to
dangerous cosmic rays and solar flares. In fact, earth's protective
magnetic field serves several purposes:
Navigation by humans (using compasses, and now GPS)
Navigation by animals who can sense earth's magnetic
field
Protection from both solar flares and cosmic rays
“Our
planetary magnetic field has many advantages. For over 2,000 years,
travellers have been able to use it to navigate across the globe.
Some animals even seem to be able to find their way thanks to the
magnetic field. But, more importantly than that, our geomagnetic
field helps protect all life on Earth.”(Small 'Fair Use' quote
from EARTH)[67]
A
NASA
paper suggests
it may drop to zero: “If the magnetic field of the Earth
suddenly changed...one might expect the field to go to zero strength
for a century or so.”[62] The
Smithsonian Institution quotes
one scientist with a similar figure: ““When the
[magnetic] field is weak, which is during reversals, the
main dipole field collapses to something on the order of ten
percent of its normal strength,”
Singer says.
This collapse could spell trouble for life on Earth, since the
magnetic field stabilizes ozone molecules, shielding the planet from
ultraviolet radiation.”(Emphasis added in bold and underline
for clarity, not in original.)[63]
|
I
mage
8. Photo of one of the Voyager spacecraft, of NASA's “deep
space” Mariner series, and a reminder that similar
satellites and NASA equipment, closer to earth, are vulnerable to
solar geomagnetic events[82]
|
9b.
The
upcoming
pole reversal
predicts a collapsing geomagnetic field
[PART II: Key findings – continued]
Oddly−enough,
the times I calculated from two (2) independent sources for the
earth's magnetic field to drop another 30% (either 363.157578 year or
338.5281 years) are almost the same as the time needed for earth to
do a “magnetic flip,” at the rate it's been going of late
(either 333.9583 years or 364.3 years), calculated from two other
independent sources—thus, a total of four (4)
or more separate
(independent) sources were used:
|
TABLE
3. Selected data comparing rate of geomagnetic
field collapse with rate of “magnetic flip”
|
|
What is under review?
|
Amount of time needed (with
comments)
|
Source(s)
|
|
How long it's estimated the earth's protective
geomagnetic field will drop by another thirty (30%) percent—e.g.,
to 70% percent of current levels?
|
(0.94)^ 5.764406 = 0.70 or about 70%. [So,
5.764406 periods of 63 years each is 363.157578 years.], SAA, that
is, the [the “South Atlantic Anomaly”] drops by about
6% (to 94%) in the approximately 63−year period reported,
and thus would need 5.764406 periods of 63 years, that is, about
363.157578 years.
|
This estimate calculated from data obtained
from PHYS.org[56]
|
|
How long it's estimated the earth's protective
geomagnetic field will drop by another thirty (30%) percent—e.g.,
to 70% percent of current levels?
|
(0.90)^ 3.385281 = 0.70 or about 70%. [So,
3.385281 periods of 100 years is 338.5281 years.], planet−wide:
Earth's entire geomagnetic field drops by about 10% (to 90%) every
century (100−year period), and thus would need 3.38528
periods of 100 years, each, that is, about 338.5281 years.
|
This estimate calculated from data obtained
from SCIENTIFIC AMERICAN[58]
|
|
How long (at a reported rate of 55 km/year)
will it take for earth's magnetic poles to “flip,”
given a known circumference of earth?
|
[20,037.5
km/year] divided by [55 km] = about 364.3
years to 4 significant figures.
|
The 55 km/year figure is taken from multiple
sources.[60][61]
|
|
How long (at a reported rate of 60 km/year)
will it take for earth's magnetic poles to “flip,”
given a known circumference of earth?
|
[20,037.5
km/year] divided by [60 km] = about 333.9583
years.
|
The 60 km/year figure is taken from multiple
sources.[64][65][66]
|
|
I'm taking the average of the four figures
above.
** Editor's Note: The
decreases in earth's magnetic field occur together with (are
associated with) each magnetic “flip,” a well−known
phenomenon.
|
Mean (average) time−lapse of 349.9859945 years,
or about 350 years. However, the top 2 figures ask only about how
soon we will see another 30% drop in geomagnetic field strength.
The bottom 2 figures outright contemplate a “pole flip,”
in which earth's protective geomagnetic field may collapse to 10%
or less. So, after the “average” time, we may see LESS
THAN the 70% strength (e.g., only a 30% field loss) than expected,
as the bottom 2 figures suggest a faster collapse. If this is so,
then the top 2 figures may be correct for now—but may become
obsolete or outdated of earth's magnetic field collapse continues
accelerating even more.
|
Sources: Those cited above, taking an
arithmetic mean (average).A “Geometric mean” (that is,
the product of all 4 data, and take the 4th root) would
be 349.71 years to 5 significant figures, but as
it's so close to the arithmetic (additive) mean (349.9859945
years,) that we can safely ignore it.
|
I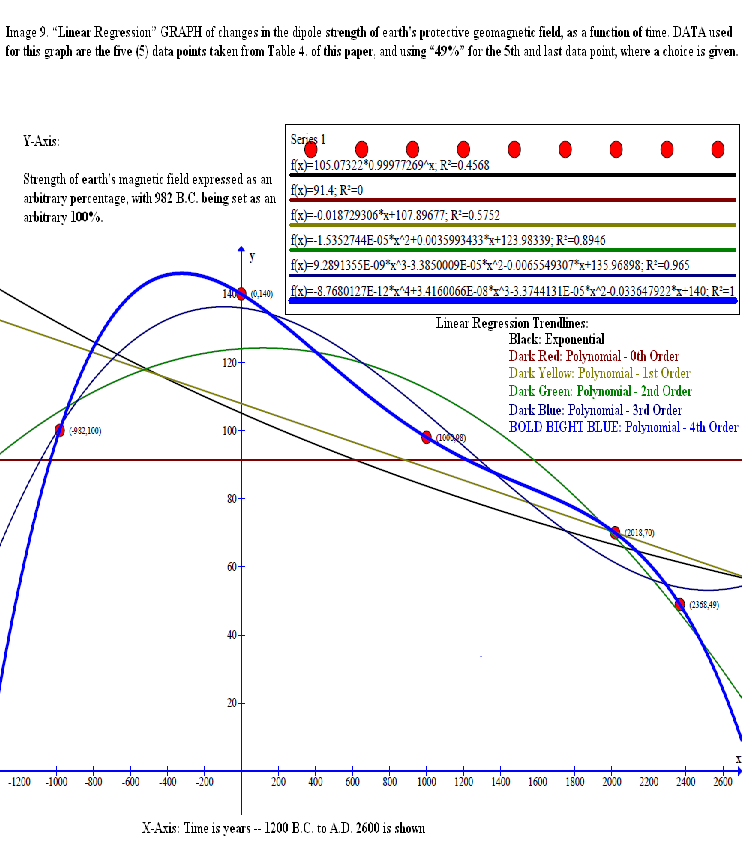
mage
9. “Linear
Regression” GRAPH of changes in the dipole strength of earth's
protective geomagnetic field, as a function of time. DATA used for
this graph are the five (5) data points taken from Table 4. of this
paper, and using “49%” for the 5th
and last data point, where a choice is given.
Since
these two phenomena are related, that is to be expected:
If a complete “flip” occurs, the field will probably not
drop to zero, but it will decrease significantly. And, as both
phenomena (the decreases in earth's protective magnetic field and the
velocity of the geomagnetic pole movements) seem to be rapidly
accelerating in recent centuries and decades, this leaves us more
vulnerable to any geomagnetic solar events, such as documented and
discussed above. Even if my research over−estimates the
probability of another catastrophic geomagnetic event, nonetheless,
this much is clear: Given the dire consequences of documented damage
that would be done, it's best to have a cautious and conservative
estimate—especially given new unknowns and variables, such as
the impending geomagnetic flip & concomitant collapse of earth's
protective magnetic field—which, of course, make us even more
vulnerable to a “direct hit.” Therefore, section 11.,
below, Recommendation (for lawmakers and citizens) should be given
careful review.
|
Table
4 – Data used to graph changes in earth's magnetic field
strength in recent millennia:
|
|
Year
|
Strength in earth's magnetic
field, using 982 BC as the “baseline” for a 100% level
of dipole strength. Comments to explain calculations.
All figures expressed in
percentage values (for ease of reading)
|
Percent
value
(restated
for clarity)
|
Source(s) cited
|
|
982 BC
|
In a 2018 paper, PHYS.org
states[56] that: “The geomagnetic field has been losing 30
percent of its intensity in the last 3,000 years.” –
We chose this arbitrary value (for year 982 BC) to be “100%”
for convenience of calculations of other figures.
|
100%
|
PHYS.org[56]
|
|
AD 0
|
In a 2000 paper, the Geophysical Journal
International states[72] that: “the
Earth’s dipole moment was twice the present−day value
2000 years ago, whilst between 5000 and 6000 years ago it was much
weaker.”
–
Twice our arbitrary 70% modern−day value is 140%.
|
140%
|
GJI[72]
|
|
AD 1000
|
Both Merrill
(as cited by CRI[73])
and Barnes (as cited by The
University of South Dakota[74]),
both claim that earth's magnetic field was approximately 40
percent stronger in AD 1000 than at the time of their writing.
(The CRI article was originally written in 1998, and the U of SD
page was updated in 2014, but we approximate 2018, since this is
fairly close.) If it were 40% stronger, then you get: (1.40)*(70%)
= 98% of the strength at this time. [Editor's
note: While I trust the CRI figure, it was from a 'religious'
organisation, and may have has bias, so I obtained an assessment
from an independant source, namely the University of South Dakota,
which made the same assessment of geomagnetic field strength for
year AD 1000.]
|
98%
|
CRI[73]
and
UofSD[74]
|
|
AD 2018
|
Since PHYS.org states[56] that
we've lost 30% in the past 3,000 years, this figure will be 30%
less,than the arbitrary baseline value 3,000 years earlier for
year 982 BC, e.g., 70%.
|
70%
|
PHYS.org[56]
|
|
AD 2368
|
The arithmetic mean of the 4 data points from
my Table 3., above, is about 350 years for another 30% drop, so,
adding 350 to AD 2018 yields AD 2368. Then, another 30% drop of
the 70% current level of earth's dipole yields (0.70)*(70%) =
49%. ALTERNATE figure for
2368:
The Smithsonian Institution[63]
suggests that the field strength may drop off to 10%
during a pole flip, and NASA[62],
which is quoted as saying: “one
might expect the field to go to zero strength for a century or
so,”
suggests that earth's protective geomagnetic field may drop off to
0.0%
– during a “flip,” so, taking the average, we
get an estimated 5%
field strength for AD 2368.
|
49%
or:
5%
|
Table 3., above
|
I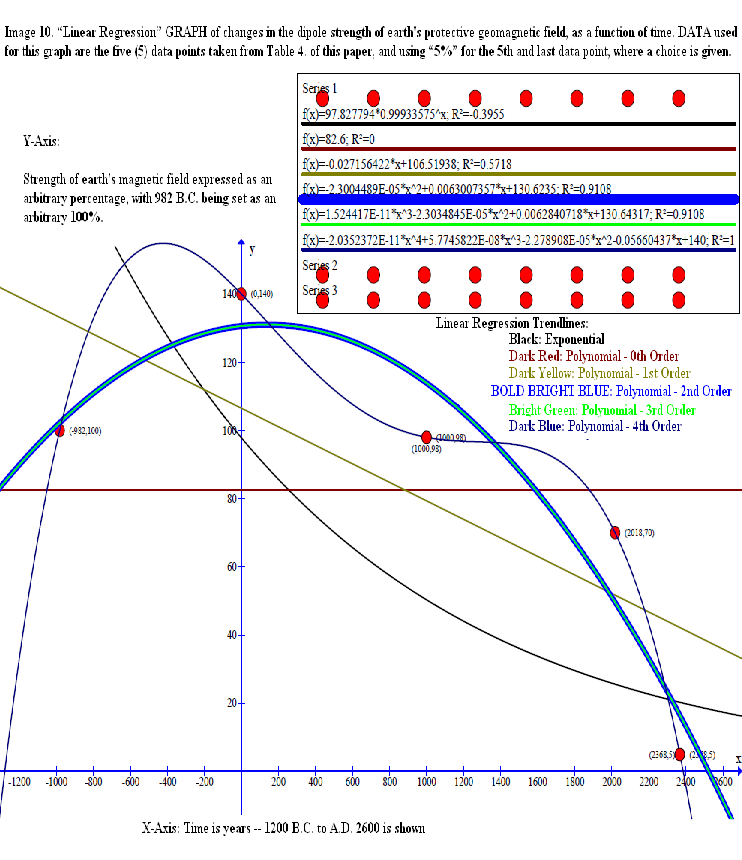
mage
10. “Linear
Regression” GRAPH of changes in the dipole strength of earth's
protective geomagnetic field, as a function of time. DATA used for
this graph are the five (5) data points taken from Table 4. of this
paper, and using “5%” for the 5th
and last data point, where a choice is given.
10.
Conclusions
The top half of this
paper documents that, historically, we have encountered more damage
to our communications and power grids than is commonly known, the
recent outages in Canada and the northeast united states on several
occasions to the very least—as well as interference to
satellites, GPS, and other infrastructure—even military sea
mines being triggered by changes in the earth's magnetic fields from
a severe solar event.
However,
[[#1]]
any threats that solar events already
pose can [[#2]]
only be expected to worsen
as earth's protective magnetic field continues to collapse—and
this is [[#3]]
also
compounded as GPS and other navigation continues to lose accuracy as
the geomagnetic north and south poles rapidly accelerate their
velocity due to unknown geological causes within earth's core. Our
environment is giving us the
1−2−3 knockout punch.
I did not even account for nuclear EMP detonations by rogue nations
(which can have similar effects on the electrical portion of the
grid).
As
can be seen from the second graph (Image 10) using the Table 4. data
I obtained from other peer−reviewed research, the 2nd
and 3rd
order polynomial trendlines are almost identical. This was an
unexpected result, since, of course, in the first graph (Image 9),
using all the same data points except the last (where I did not
factor in the field collapse predictions), all the “trendlines”
are quite noticeably different.
Whether
this is a random occurrence or not, nonetheless, this researcher
infers that changing the last data point from 49% to 5% made an
improvement on the prediction, since it factored in the nearly
complete expected field collapse (down to 5%, not 49%) when a
magnetic “flip” occurs. This prediction is tenable based
on what we know about past geomagnetic “pole flips,” and,
if this is an improvement on the data, then this may explain why the
2nd
and 3rd
order trendlines are so identical that I had to make one of them
very, very wide, and make the other one a bright green colour, so as
to differentiate it.
My two graphs (Images
9 and 10, above) use only five (5) data points, each, and, as such,
are probably not quite as accurate as those of other researchers with
more resources and collaboration; however, as my data are from
reliable sources, and carefully reviewed by this researcher, any
errors are expected to be small:
In conclusion, I chose
5 reliable data points for each graph for time periods within the
recent several centuries, and showing an approximate “peak”
in dipole strength around the time of Christ, so the trendlines
generated from these graphs should be reliable for several centuries
out into the future.
My inference is that
these trendlines are accurate, and thus sometime around A.D. 2500, we
can safely expect a magnetic flip, with the dipole strength of
earth's magnetic field dropping to about 5% for an appreciable length
of time.
This would leave us
almost completely vulnerable to both cosmic rays as well as random
solar geomagnetic storms, CME's, flares, etc., but (and more
importantly), even for those of us who are here and now, the
continuing field collapse will likely increase our vulnerability to
solar events, even if we don't wait until A.D. 2500: Since we have
encountered severe damages from past solar events with the field at
present (or stronger) levels, then earth's decreasing magnetic field
will only make matters worse, which brings me to my conclusion: We
must heed the warnings in the following sections.
11.
Recommendations [PART III: Proposed solutions]
11.(A)
Recommendations for lawmakers
This
paper focuses mainly on solar flare and CME (coronal mass ejection)
threats, but EMP nuclear detonations also pose a threat—Discover
Magazine
recently reported that an EMP 'test' bomb was set off and “even
though the test site was about 900 miles from Honolulu, the blast was
strong enough to be seen from the island and take out a transmission
station.”[68] Besides severe solar geomagnetic events, nuclear
EMP detonations[68], and cosmic ray threats, the power and
communications grids already must prepare for hurricanes, rainfall,
droughts, wildfires, and more commonly experienced extreme weather
events. (Rainfall, in fact, is known to be a perennial problem for
power, phone, and internet cables, many of which are underground.)
But, in this paper, I concentrate on the solar CME's, solar flares,
and nuclear EMP events—and propose relatively simple mitigation
measures—for lawmakers and for citizens. I do acknowledge the
current administration's recent efforts: “President Trump has
signed an executive order (EO) to boost coordination for and national
resilience against electromagnetic pulse (EMP) threats—both
from nuclear warfare and natural events like solar superstorms,”
as reported by POWER
magazine{“Trump Acts on Critical Infrastructure Resiliency
Against EMP Threats,” by Sonal Patel, POWER,
26 March 2019}[69], but much more needs to be done by lawmakers and
leaders of both political parties. For lawmakers (particularly
Federal lawmakers), I offer these proposals:
Local voltage surge protection devices and/or filters,
and even “double−surge” protection in critical
electric power, communications, and military infrastructure; Require
critical infrastructure to also include EMP power line transient
suppressors;
Upgrading cables, wireless communications systems,
electric substation control boxes/houses, and operating centres to
be properly hardened, shielded, and grounded with such as a “Faraday
Cage”;
Use of fiber optic−based communications, where
possible (which, of course, aren't susceptible to electromagnetic
pulses);
Sufficient “backup” systems to store
critical data and provide alternate power in the event of a power
outage, including alternative power sources (solar, wind, etc.);
Having “backup systems” unplugged &
disconnected from the grid would help protect them greatly:
Disconnecting any sensitive “backup” excitement
(computers, solar panels, etc.) from wires (which could pick up an
EMF pulse and induce a high−voltage current) would also
greatly help, especially if they contain very little 'sensitive'
electronics that could be affected by an EMP;
“Capacitor
banks,” which work like batteries to absorb & dissipate
excess energy;
Possibly even an artificial geomagnetic field (using a
combination of electromagnets and permanent magnets) across the
globe: Would require much international cooperation
PREVENTION: Forecasting or predicting a solar event,
and shutting down (disconnecting) sensitive equipment from the grid
is a good precaution. (Proper monitoring of solar events by
satellites and deep−space probes would be useful here.);
Creating guidelines and emergency plans for “black
start” and “grid hardening” measures that will
improve resiliency and recovery;
Research, preparation, & review of emergency plans
for EMP & solar geomagnetic event scenarios (like is done with
hurricanes and earthquakes).
Protect critical computers / Internet from hacking &
cyber-attacks and computer viruses (and not just EMP nuclear
detonations or solar flares / geomagnetic storms).
Prevention
and protection in advance would cost Billions of dollars, but
cleanup of the mess from a severe EMP or solar event would cost
Trillions of dollars—several orders of magnitude greater in
cost (not counting the emotional and social costs). Quotable
quotes:
“An
ounce of prevention is worth a pound of cure.”
“A
Billion in prevention is worth a Trillion in cure.”
“Prevention
is the best medicine.”
11.
Recommendations [PART III: Proposed solutions, continued]
11.(B)
Recommendations for citizens
Have plenty of canned and non−perishable food &
drink stored, manual can openers, water for bathing & flushing
the toilet, as well as potable drinking water. Peanut butter is an
especially good source of fats, proteins, and carbohydrates, and has
a long shelf life. (Include Emergency First Aid Kits, prescription
and over−the−counter meds, as needed, and also personal
items like soap, shampoo, and plenty of toilet paper and/or wash
cloths, if you run out of toilet paper—and spare clothing &
underwear.)
Have handy printouts (paper) of important names,
addresses, phone numbers, and websites of key emergency contacts
(friends, family, police, fire, hospital, electric power & phone
companies, local news media phone numbers, to get the latest news,
local emergency shelter, animal shelters, etc.), as well as hard
copies of good personal, scientific, and religious reading materials
(which can come in handy if computers and television grids go down).
Also a map (paper printout) of your city—and surrounding
cities—might be useful.
Besides these key paperwork items, ID's, e.g. driver’s
license, photo ID's, Cash, Credit Cards, and several extra set of
house, car, & storage building keys.
Have printed and/or flash drive (thumbnail USB storage
devises) of key paperwork (financial, insurance, & medical
records, with deeds and titles to house, vehicles, etc.).
Invest in several small magnifying glasses (which can
be used to start a fire with the sunlight, as well as help you to
read fine print if you're far−sighted)
Have standby generators, backup batteries (preferably
NiMH or Li−Ion rechargeable), and/or solar−powered
chargers and power supplies. (This is especially needful for
portable smart−phones, which need to be charged up
periodically.) Portable fire extinguishers would also be useful
here.
Invest in EMP power line transient suppressors and
voltage surge protection devices and/or filters;
When storing your backup generators, leave extension
cords UNPLUGGED, lest a solar or EMP event occur, and induce a large
current in the lines, and “fry” your equipment. Same is
true with radio and television and computer equipment: Don't put
them in storage connected to power sources, antennas, etc. (Perhaps
wrap “spare equipment” in several layers of aluminum
foil, a “makeshift Faraday Cage,” and place this in a
metal garbage can, for extra−added 'Faraday' protection.)
Make sure that stored equipment (batteries, gasoline,
tools) has not rusted or gone bad.
Invest in 1 or 2 cheap bicycles (which will come in
handy should petroleum−based fuel becomes scarce), as well as
a bicycle air pump, chain oil, etc.
Invest in some FRS (Family Radio Service), GMRS
(General Mobile Radio Service), CB (Citizen's Band), and/or Ham
(Amateur) radios as an 'alternate' form of local communication,
should the cellular phone grid go down. [NOTE: GMRS and Amateur
radios require a license from the FCC to operate, whereas FRS and
Citizen's Band don't, but during a state of emergency, that may not
matter.]
Invest in several solar−powered weather radios,
which include AM, FM, NOAA Weather, and local television broadcast
frequencies. (Portable televisions are optimal, but, lacking that,
radios that receive audio of TV broadcasts are a good substitute.)
Invest in several small LED flashlights. (LED's,
light−emitting diodes, use far less current than 'regular'
incandescent light bulbs, and produce much less heat.) Some
flashlights have solar and/or “hand crank” chargers.
Have handy emergency medical kits (in the event
hospitals lose power and/or become over−crowded.)
Maintain close ties with friends, neighbours,
relatives, local government (police, fire, etc.), and church &
community groups, as teamwork would become necessary in the face of
adversity.
12.
Ethics declarations:
I
self−identify and lean noticeably to the “Conservative
right” end of the political spectrum, and, like many of my
peers and colleagues on my end, am leery of claims of climate change
or other “environmental” issues, and, as such, may have a
slight bias “against” making a full declaration of any
potential environmental hazard; therefore, my research might
accidentally (due to human error) underestimate any potential solar
flare environmental threats. [Any bias, if it exists, is not
intentional, as good science must be without bias, preconceived
ideas, or other prejudices.] Furthermore, when I was young, I was a
CB (citizens band) and ham (amateur) radio enthusiast, and currently
hold an Amateur Extra license (the highest license that the FCC
confers), with call letters “N2GY”:
https://wireless2.FCC.gov/UlsApp/UlsSearch/license.jsp?licKey=2702986
http://HamCall.net/call/N2GY
https://www.FccBulletin.com/callsign/?q=N2GY
http://www.InterceptRadio.com/ham.php?call=N2GY
https://www.RadioReference.com/apps/ham/callsign/N2GY
http://www.MyHamShack.com/CallsignDatabase/N2GY/Default.aspx
Therefore, I also
have a “bias” for science and radio electronics, and
particularly recall, in my youth, that high “solar activity”
would interfere with local HF (high frequency) communications, but
also “charge” the ionosphere, and help increase “skip
wave” radio communications, in which 'regular' CB and Ham
radios could communicate at far−greater distances during times
of high solar “skip” activity. I am not sure what net
effect (if any) such a bias to be fascinated with radio−electronic
communications science might have on this present research (whether
to exaggerate or diminish results), but I do declare this bias in my
ethics statement to be whole, complete, and transparent.
I
have not received any compensation (financial or otherwise) for my
research, and declare no conflicts of interest in this regard. [But I
am actively seeking and soliciting financing, should any donors be
willing: Please contact me through my websites or social media:
https://GordonWatts.com
/ https://gordonWAYNEwatts.com
/ https://YouTube.com/GordonWayneWatts
/ https://Facebook.com/GordonWayneWatts
/ or via email: Gww1210@gmail.com
/ Gww1210@AOL.com
]
13.
References
(Literature cited), Acknowledgements,
& Appendix
I
cite all my references
above, in Section 4, but don't list them alphanumerically, as that
would require additional manpower. The references, though not
alphabetised, are sufficient. Acknowledgements:
I would like to acknowledge George Noory, the regular host of “Coast
to Coast: AM” (Link: www.CoastToCoastAM.com)
for having brought this matter to my attention: His overnight radio
call−in program, which used to have the late Art Bell as a
regular host, has regular guests of various (and opposing) topics,
some related to science and health, and, in particular, Mr. Noory has
taken it upon himself to lead in advocating Federal legislation to
mandate a “Hardening of the Grid” of our communications,
power, and military infrastructure, in order to protect against the
inevitable solar flare event, or a possible EMP attack. I also
acknowledge and thank my dear mother for putting up with me taking
time off from my regular work to do this research. APPENDIX
of tables only, not of images or sections:
Table 1:
List of solar storms;
Table 2:
Selected data from other published research;
Table 3:
Selected data comparing rate of geomagnetic field collapse with rate
of “magnetic flip”;
Table 4:
Data used to graph (with trendlines aka “linear regression”)
changes in earth's magnetic field strength in recent millennia—as
a function of time.
14.
Rights and permissions
I place my research into the Public Domain, but with the
simple attribution requirement that it be left unaltered, and with
proper attribution given to me by name (Gordon Wayne Watts) and
personal research websites (GordonWatts.com and gordonWAYNEwatts.com
– which are not case−sensitive, but stylised this way for
appearance purposes only). Anyone referencing my websites my stylise
and capitalise them as they see fit, but I'm listing it thus for the
convenience of readers for ease of memory. Of course, small “Fair
Use” quotes may be used with attribution, as well, as permitted
by applicable Federal and International law.
About
this article: VERSION
2.0 – Not “Received”
or “Accepted” as yet by any major peer−reviewed
scientific organisation. This article has been reviewed and edited by
the author, but by no one else. As such, it originally bore the
designation as “Version 1.0.” I've minor typo corrections
and added one suggestion from a Conservative Republican friend, who
suggested that I add “protect from cyber-attacks” to my
proposed solutions. This revision is “Version 2.0.” [I am
not identifying my friend, as a professional courtesy, but I felt
it's important to mention that he's a fellow-Conservative like
myself, so that it's clear that there's plenty of support for this
issue from both sides of the political isle, where we can agree on
many things regarding protecting the environment.]
Article is available in several formats – and down-loadable
from several mirrors, as follows:
Link
1: https://GordonWatts.com/SolarFlarePAPER.pdf
Link
2: https://GordonWayneWatts.com/SolarFlarePAPER.pdf
Link
3: https://GordonWatts.com/SolarFlarePAPER.doc
Link
4: https://GordonWayneWatts.com/SolarFlarePAPER.doc
Link
5: https://GordonWatts.com/SolarFlarePAPER.html
Link
6: https://GordonWayneWatts.com/SolarFlarePAPER.html
Share
this article: Anyone you share the following link with will
be able to read this content: See top.
Subjects:
Solar physics • Statistics • Environment • Radio
Electronics • Public Safety • Politics • Law
Further
reading:
See my References section for further reading.
EDIT
YOUR PAPER!!!
– Notes: Editing
has been done, and has passed stage 1 of the edit process; Now, I
shall aspire to submit this to peer-reviewed scientific
organisations, lawmakers, and news outlets for proper review, press
coverage, and legislative action. –
Gordon Wayne Watts, author///
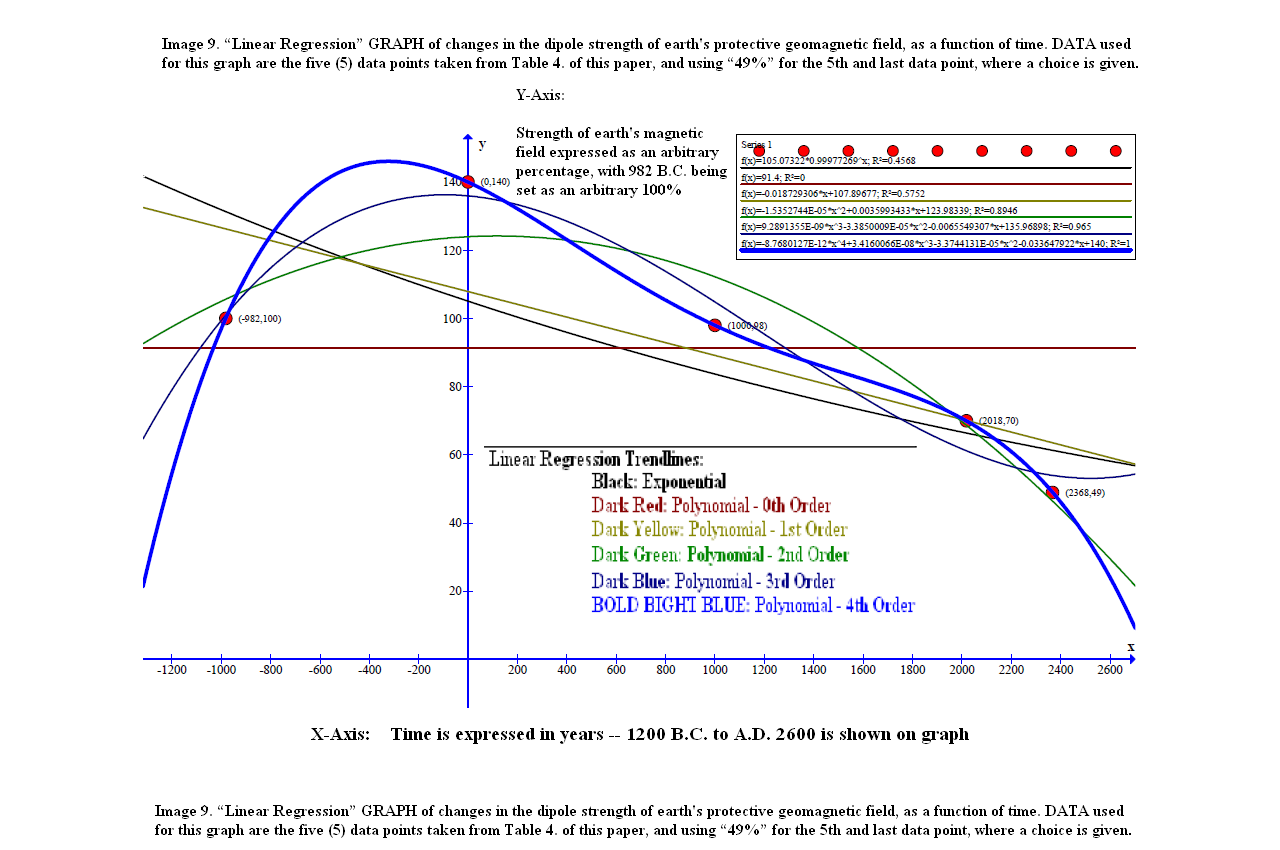
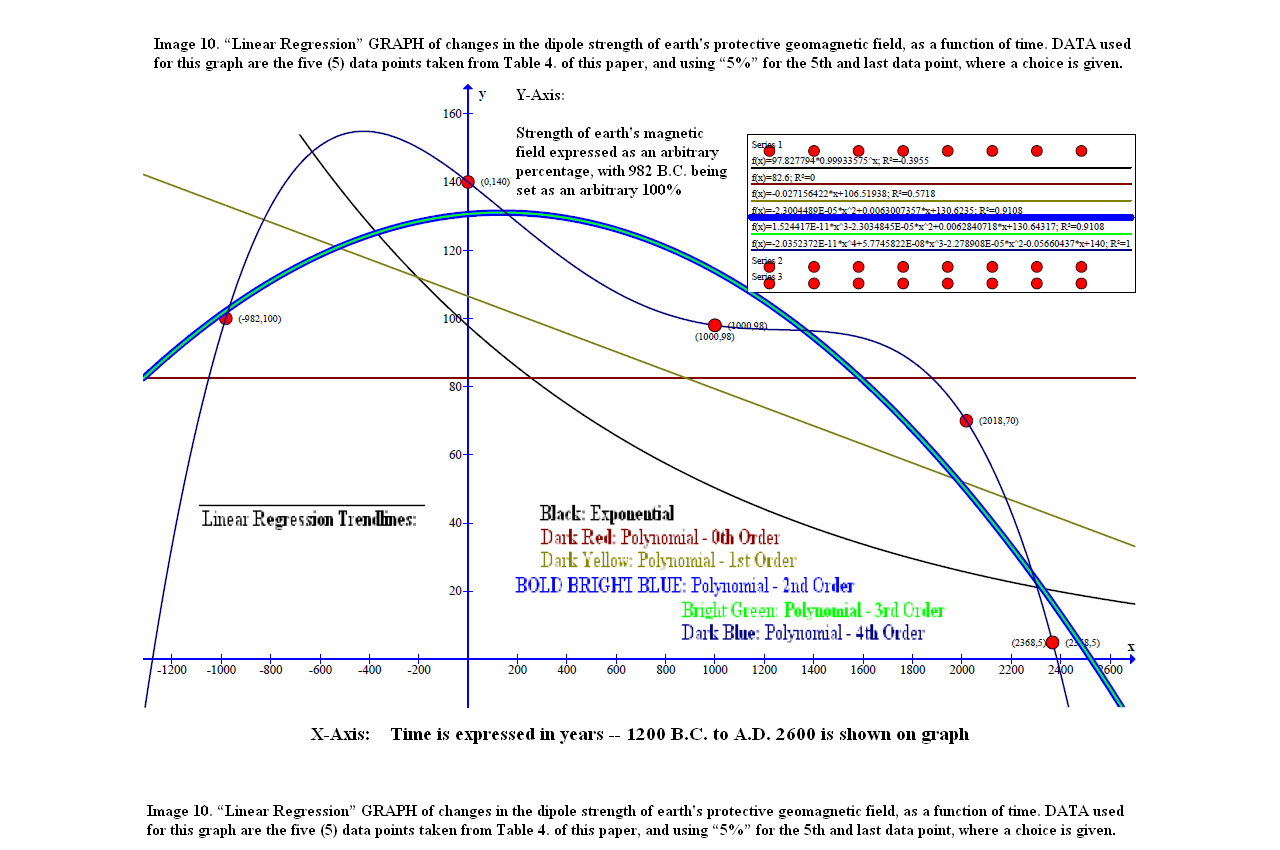
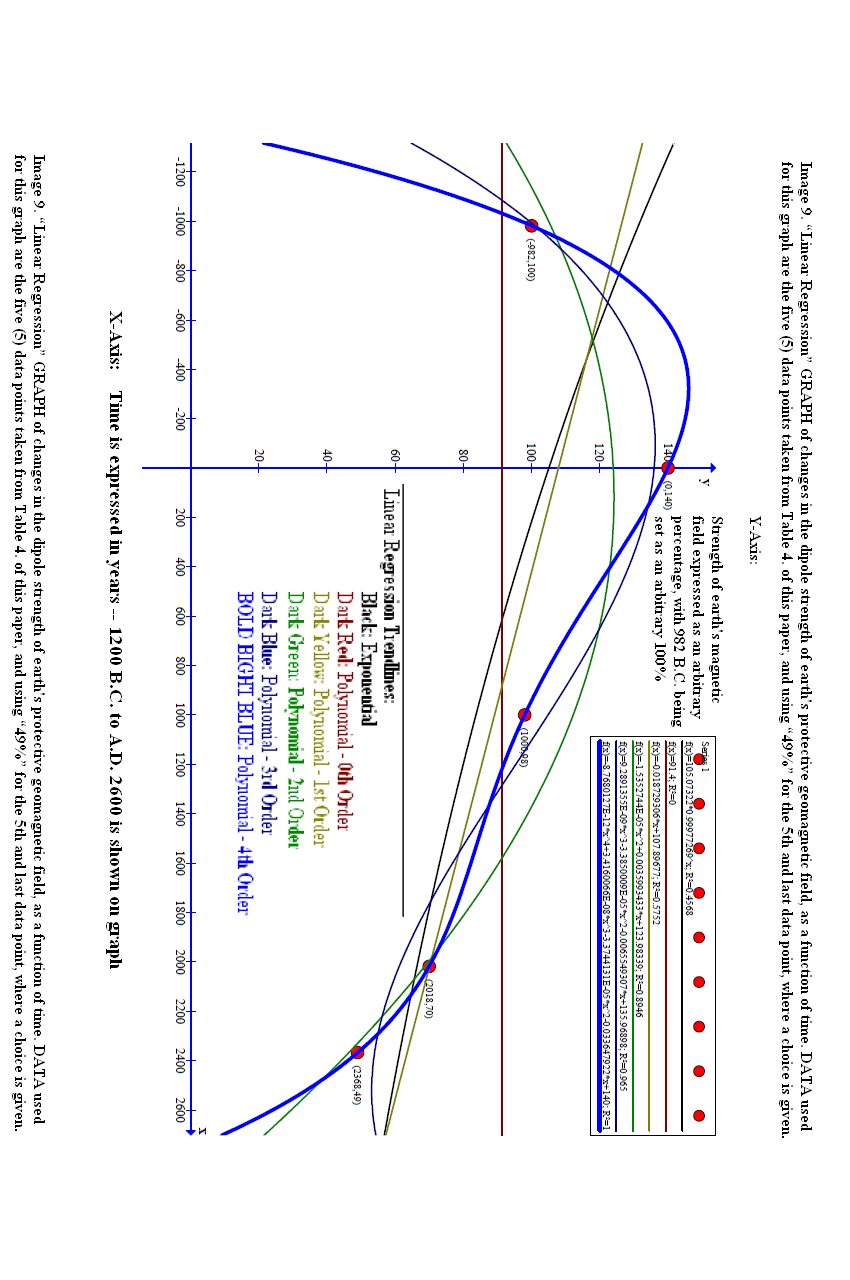
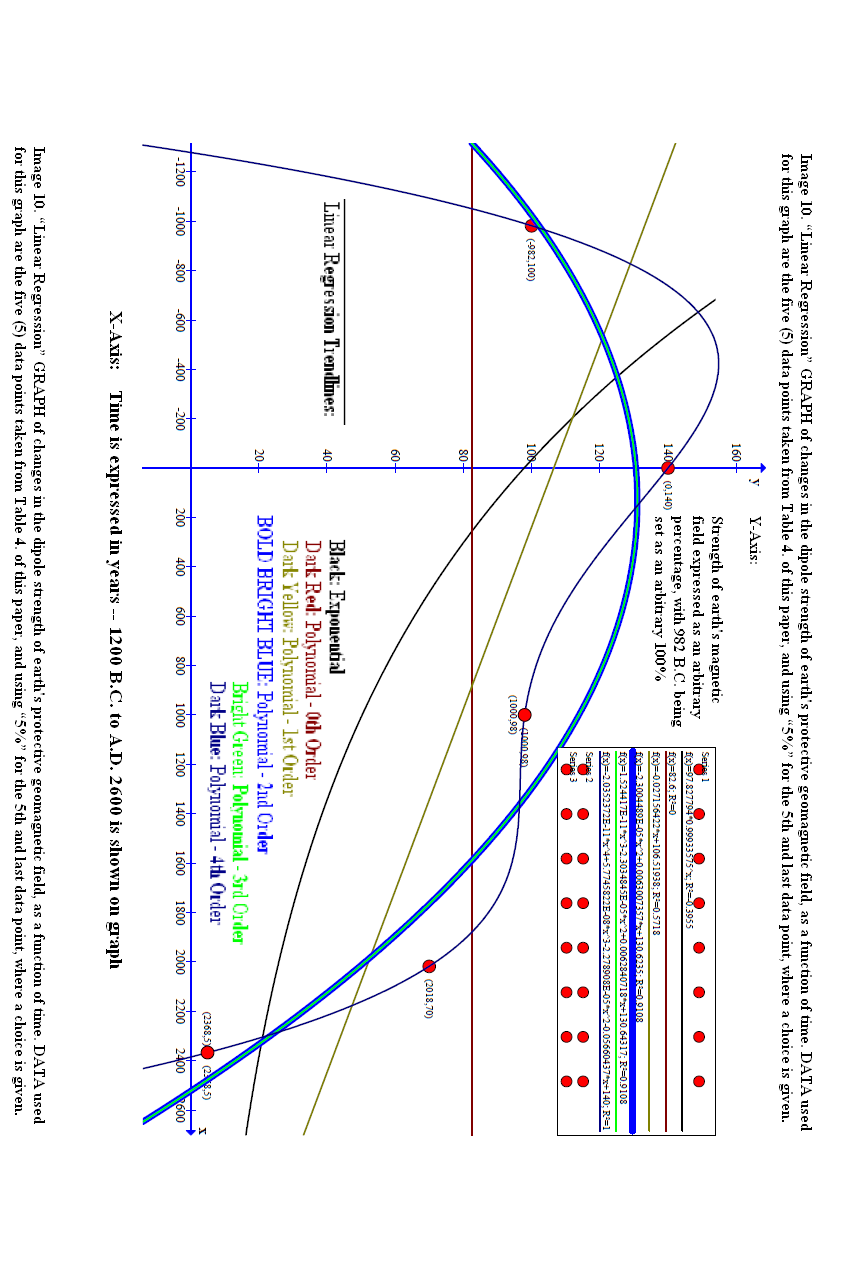